Tag Archives: B2B data management

Business analyst reviewing performance dashboards to address the GTM data latency problem and improve decision-making speed

The Data Latency Problem: Why GTM Teams Lose Pipeline to Stale Insights

The GTM data latency problem is not about wrong data, it’s about late data. Most organizations assume poor decisions trace back to inaccurate information. The real culprit is timing: intelligence that arrives after the window to act has already closed.

This timing problem is a hidden risk in Revenue Operations and Go-To-Market systems. Their analytics focus more on deep reporting rather than how quickly data can be delivered. Monthly pipeline reviews inform weekly execution calls. SDR teams receive intent signals after buying windows have cooled. Forecasting models reflect historical snapshots instead of live pipeline movement.

A 2024 RevOps survey found that 57% of critical GTM decisions are made before fresh data is even available. A 2025 benchmark of 68 revenue-focused organizations found that 79% of revenue-critical systems were still fed by batch-based pipelines, with a median end-to-end latency of 26 hours.

In B2B environments where buyers move from anonymous research to vendor shortlists in days, a 26-hour intelligence lag is not a minor inefficiency. It is a structural competitive disadvantage.

Why the GTM Data Latency Problem Is Now a Revenue Liability

Modern B2B buyer behavior moves faster than legacy reporting cycles were built to handle. Buying committees form and evolve rapidly. Budget priorities shift within weeks. Leadership changes open or close pipeline opportunities with no advance notice.

A 2024 study of high-intent accounts found that 54% of accounts signaling strong buying intent converted to meetings within 48 hours, and 78% showed no active signal beyond the 72-hour mark. GTM teams often act on outdated data, one to three days old, which means they target buyers who’ve moved on and rely on signals that have already expired.

Research by HBR shows that firms responding to inbound leads within an hour are seven times more likely to qualify those opportunities than those who take even a little longer. Still, most revenue stacks take 8 to 24 hours to provide insights. This delay can be a real issue. For example, a lead generated on Monday might not reach a sales rep until Wednesday, accumulating about 54 hours of delay. Since the chances of converting a lead fall off sharply after just an hour, that backlog turns into missed opportunities.

You can read more about data prioritization in B2B here.

Four Structural Sources of Data Latency in GTM Stacks

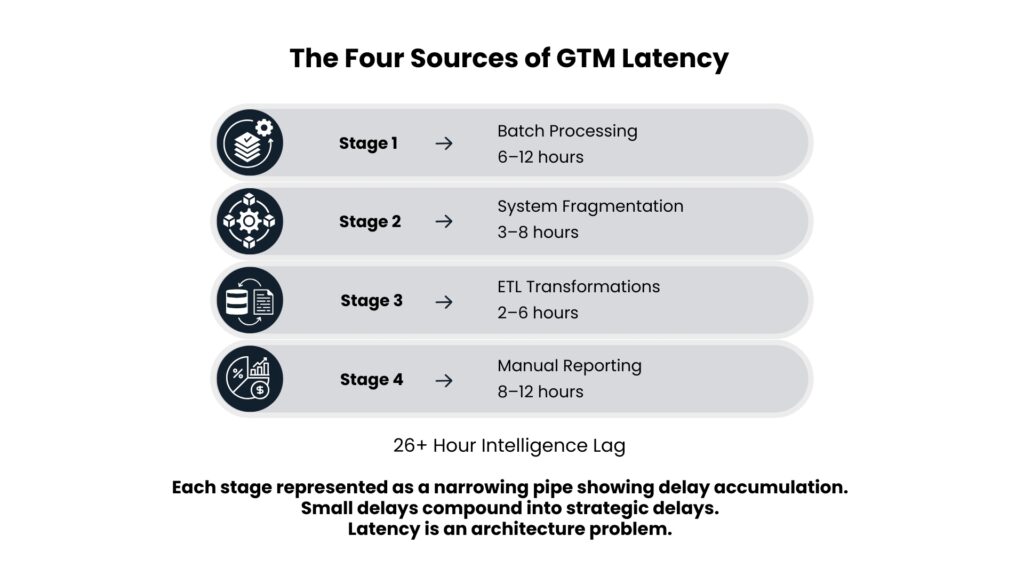
The GTM data latency problem is not a single bottleneck. It compounds across four interconnected layers.

Batch Processing Pipelines

Most enterprise data warehouses still run on batch-oriented ETL cycles. Raw events are grouped and processed on hourly or daily schedules. Even when event collection happens in real time, batch transformation introduces hours of processing lag before any signal reaches an operational system. A 2025 audit found the median end-to-end latency across these systems at 26 hours.

Fragmented System Architecture

On average, businesses use 8 to 12 tools for their revenue stack. When a high-intent signal comes in, it needs to go through web analytics, marketing automation, a data warehouse, enrichment services, a scoring engine, a CRM, and a sales engagement platform. With each step taking 30 to 90 minutes, the urgent lead from the start of the day can become outdated by hours. And it gets worse – integration issues don’t just add time; they multiply delays.

ETL Transformation Delays

Transformation logic introduces additional lag through complex joins between Salesforce, CDPs, enrichment providers, and intent platforms. Late-updating reference tables and territory mappings create a patchwork state where some attributes are current and others are weeks old. This partial staleness is operationally worse than plain latency because it produces misleading intelligence rather than a visible gap.

Manual Reporting Cycles

A significant share of business intelligence still runs through human-generated analysis. Analysts export data, clean it in spreadsheets, and prepare slides for leadership. This cycle often adds 8 to 12 hours on top of system latency. One 2025 case study found that 41% of urgent pipeline and forecasting requests were not completed until two calendar days after the triggering event.

Revenue Consequences of Unresolved Data Latency in GTM Systems

Each of the following consequences traces directly to unresolved data latency in GTM systems.

Missed Buyer Windows

High-intent signals lose conversion value rapidly. A 48-hour delay in routing intent-driven accounts was estimated in one RevOps stack to cost 19% of potential pipeline from that cohort. Organizations technically possess the right intelligence. They operationally fail to act before the opportunity expires.

Structurally Inaccurate Forecasting

A 2025 RevOps benchmark found that models updated once per week had 16 to 22% higher error rates compared to models ingesting data within 12 hours. Models trained on daily snapshots overestimated close rates by an average of 13% because they lagged short-cycle velocity changes. These errors cascade into quota allocation, territory design, and budget decisions built on a pipeline state that no longer exists.

Operational Waste Across GTM Teams

Stale data forces reactive behavior. Sales reps spend hours researching accounts based on last week’s profiles, unaware of executive changes or competitive tool adoptions that occurred 48 hours prior. Customer success teams identify churn risk after intervention windows narrow. The waste is invisible in individual workflows but accumulates into measurable capacity loss across the organization.

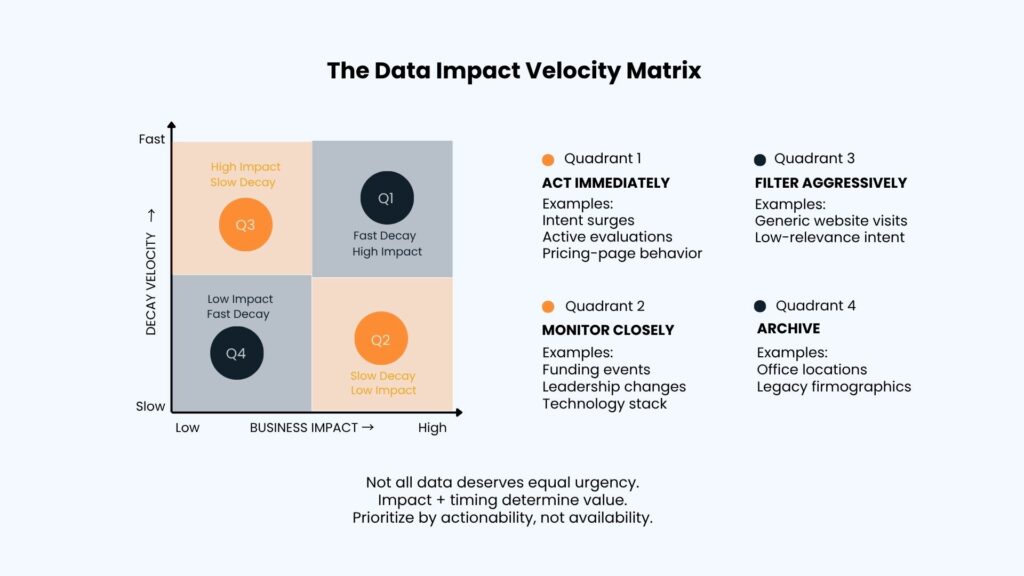
Framework: The Intelligence Velocity Matrix

Not all data requires real-time processing. Solving the GTM data latency problem starts with identifying where latency directly degrades revenue outcomes and where batch processing remains sufficient.

A practical model evaluates each data flow across two dimensions: decision frequency and value decay rate.

Tier 1: Real-Time Critical. High frequency plus fast decay. Examples include inbound lead routing, buying intent signals, and product trial engagement. These require sub-15-minute latency and justify event-driven streaming infrastructure.

Tier 2: Near-Real-Time Operational. High frequency plus slower decay. Examples include account-level engagement scoring and contact enrichment. These benefit from 15 to 60-minute refresh cycles through incremental processing or change data capture.

Tier 3: Strategic Analytical. Low frequency, used for planning. Examples include quarterly business reviews and territory design. Daily or weekly batch processing is appropriate here.

This tiering prevents over-engineering and aligns infrastructure cost with revenue impact.

How to Build a Low-Latency GTM Intelligence System

Event-Driven Architectures for Critical Signals

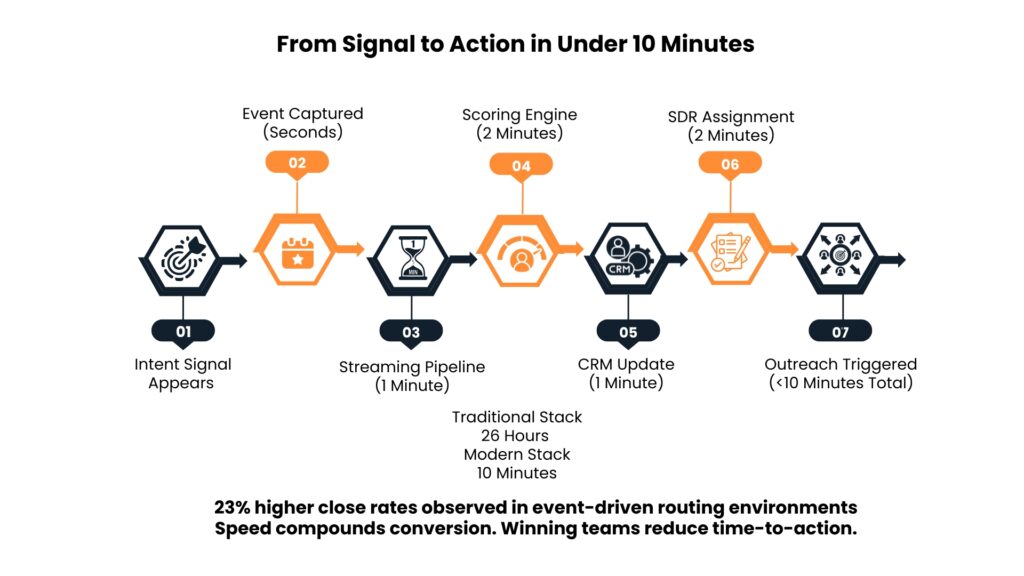
Instead of waiting for those scheduled syncs, event-driven architectures catch signals right when they happen and instantly send them off. So, when a prospect visits a pricing page or hits a product usage milestone, an event record gets sent through something like Apache Kafka. Then, downstream systems can grab that info in seconds, not hours. In one case, a RevOps team used this method to assign enterprise accounts with sudden interest spikes to a dedicated SDR pod within minutes. This led to a 23% higher close rate compared to accounts processed through batch pipelines.

Incremental Processing as a Middle Path

For organizations not quite ready for full streaming, incremental processing offers major upgrades without an extensive revamp. Rather than refreshing whole datasets nightly, systems now update only what’s changed, every 5 to 15 minutes. Plus, platforms like Snowflake, Databricks, and BigQuery make this easy via change data capture and materialized views. So, a firm dealing with 100,000 daily CRM updates could go from that big 24-hour lag to just 15 minutes – all with minor infra tweaks.

Automated Alerting and Decision Triggers

Low latency only matters when paired with automation. Top performers link smarts right into their workflows, sending real-time notifications for intent spikes, kicking off plays when pipelines lag, and routing stuff automatically based on fit. Advanced setups take it up a notch too. They can pause campaigns or switch to retargeting when conversions slow down, and adjust the timing and channels based on actual engagement.

Practical Recommendations for RevOps Leaders

First, audit the current latency and then make those infrastructure changes. Document when data hits source systems, when it gets to GTM platforms, and when decision-makers see it. You’d be surprised how many delays are lurking around that nobody tracked before.

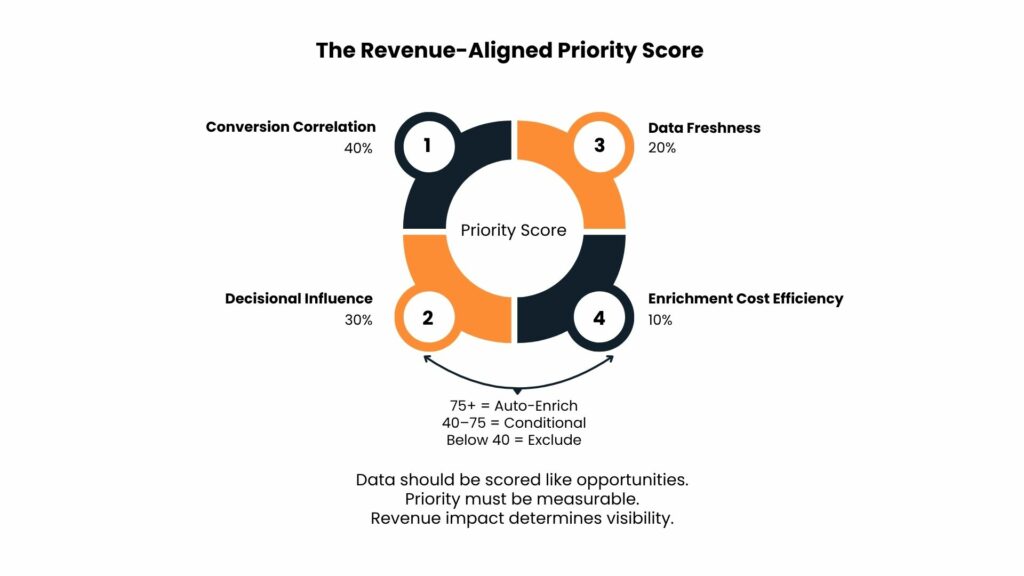
So rank the high-value data flows first. Give each one a score based on decision criticality, market dynamics, and latency tolerance. After that, focus on upgrading streaming or incremental processing for the top two to four data flows. Also, aim to get latency down from 24 hours to less than an hour first. Then, you can target reducing times from one hour to under one minute.

Set clear goals for how fresh your data needs to be. For top performers, key revenue signals should hit action inlets in under 10 minutes, lead scoring updates within 30, and opportunity data sync’d up in an hour. Companies acting ten times slower are working with stale info that could mislead decision-making.

Also, keep an eye on how long it takes for an event to affect sales actions. Treat end-to-end latency as a crucial performance indicator right next to pipeline and conversion rates.

Conclusion: Speed Determines Whether Insights Have Value

In modern GTM systems, accurate information alone is no longer sufficient. Timing determines whether intelligence creates competitive advantage or becomes operational hindsight.

The future of B2B intelligence will not be defined solely by data quality or data volume. Closing the GTM data latency gap will define which organizations convert signals into decisions.

Insights that arrive too late are, in every practical sense, indistinguishable from no insights at all.

Professional reviewing and approving digital records as part of a data trust architecture for reliable business decision-making

Data Trust Architecture: Why Reliable Data Matters More Than More Data

When the VP of Sales questions the pipeline forecast three hours before the board meeting, the problem isn’t data scarcity; it’s data credibility. This is the core challenge that data trust architecture is designed to solve. Modern B2B organizations run CRMs, enrichment platforms, intent providers, attribution tools, and AI-driven scoring engines in parallel. Yet a 2025 survey of 72 revenue-focused companies found that 68% of executives and 59% of RevOps leaders regularly questioned the accuracy of their core dashboards. That is not a volume problem. That is a data trust collapse.

According to OneStream, 72% of companies say bad data costs them at least $500,000, and more than one-third report losses over $1 million. A mid-market B2B firm, with $50 million in yearly income, actually loses around $1.25 million each quarter for every week their strategic decisions are held up because of data issues. The future competitive advantage in B2B intelligence belongs to organizations with the most trusted data systems, not the largest ones.

Why Data Trust Breaks in Revenue Organizations

Data trust rarely collapses from a single failure. It erodes through four compounding structural problems.

Definition Drift and Lineage Opacity

Definition drift is the most common fracture point. Marketing counts an “active account” using website intent signals. Sales counts it only after a validated opportunity exists in the pipeline. Finance recognizes it after the first invoice clears. A 2024 analysis of 200 B2B organizations found an average of 4.7 conflicting definitions for core metrics across departments. One SaaS company discovered a 23% discrepancy between marketing and sales pipeline numbers that stalled a market expansion decision for six weeks. RevOps teams in low-definition environments waste an estimated 40% of their analytical capacity reconciling conflicts rather than generating actionable insight.

Lineage opacity compounds the damage. Modern B2B data architectures pass through 7 to 12 transformation layers between source systems and executive dashboards. A 2025 RevOps survey found that only 19% of teams could reliably trace 90% of core revenue metrics back to their source. A telecommunications B2B provider traced an 18% variance in customer lifetime value calculations through five transformation layers to a JOIN operation excluding multi-product customers. The error had misdirected $4.2 million in R&D resources over eight months. Without lineage, debugging is archaeology.

Manual Corrections and Temporal Inconsistency

Undocumented manual corrections are equally destructive. In 68% of B2B organizations studied, finance teams make manual adjustments to revenue data that are never logged in audit-accessible formats. One manufacturing company’s monthly reporting incorporated 127 undocumented Excel adjustments maintained by three analysts. When two departed within six weeks, month-end close extended from four days to nineteen days while the team reverse-engineered the correction logic.

Temporal inconsistency in snapshot data creates a subtler but equally costly problem. When March pipeline forecasts use February 15 data but the comparison baseline uses February 28 data, the 13-day delta introduces noise that masquerades as signal. A private equity firm discovered their month-over-month growth calculations compared snapshots across different billing cycles, causing three portfolio companies to be systematically underfunded.

The Compounding Revenue Cost of Low Data Trust

Low data trust does not just slow decisions. It restructures how organizations operate, creating cascading costs that function as a hidden tax on the entire revenue pipeline.

Analytical duplication alone is substantial. A 2024 RevOps case study found an organization spending 11,000 analyst hours per year reconciling data that should have been settled once. Organizations with low data trust spend 2.4 times more on analytical headcount relative to revenue than high-trust peers.

Tool adoption collapses in low-trust environments. Enterprise analytics implementations average $2.8 million in first-year costs. When users continue relying on legacy spreadsheets, adoption stalls near 40%, tripling the effective cost per active user. A 2025 benchmark of 50 revenue teams found that 63% of SDRs and AEs used spreadsheets as their primary source for account prioritization, not the company-wide BI system.

The speed penalty is measurable. The median B2B company takes 6.2 weeks to agree on big decisions, and it spends 3.8 weeks just verifying data. Companies with low trust in their data take 31% longer to wrap up their plans. On the flip side, rivals who trust their data cut their decision-making time by 60%, gaining first-mover benefits that stack up in every cycle.

The LIVE Framework: Four Pillars of Data Trust Architecture

Building a reliable data trust architecture requires four foundational capabilities that work together.

Lineage means every metric traces back to its source through documented, auditable pathways visible to business stakeholders, not just data engineers. Column-level lineage implementation at one enterprise software company reduced analyst time spent on “where does this number come from” investigations by 73%.

Making datasets immutable is about treating them like code. This means versioning each transformation, taking snapshots at key decision points, and keeping logs of changes and reasons why those changes happened. Take a B2B logistics firm; after they started versioning their datasets, they reduced their monthly discrepancy solving time from 40 hours to just 7 hours. That’s huge!

For validation, you need checks across different levels. Start with checksums in the source system to make sure the data warehouse is accurate. Add automated business rule tests for logic checks before report publishing. Also, include cross-departmental approval steps where finance and sales teams must sign off on figures together. At a manufacturing company, a similar setup caught a currency conversion mistake in cost calculations that had gone unnoticed for 14 long months. With the new validation process, they spotted it right on day one.

Explainability means showing confidence levels right in dashboards. Including data freshness, completeness scores, and source quality ratings gives stakeholders the context needed to properly interpret the metrics. One SaaS company added confidence scoring and saw executive engagement with analytics dashboards rise 45%, as leaders got more visibility into data limitations.

You can read more about building a composable data architecture here.

A Practical Evaluation Tool: The Data Trust Scorecard

A practical way to audit your data trust architecture is the RevOps Scorecard. RevOps leaders can use a Data Trust Scorecard to measure trust in core revenue metrics. This scorecard rates each metric on four things from 0 to 5.

First, Lineage Transparency: Can we trace the metric to its origin?

Second, Governance and Process: Does paperwork exist for changes and have people been told about them?

Third, Definition Clarity: Has everyone agreed to one definition?

Fourth, Adoption and Reliance: Do stakeholders make calls based on the metric or do they secretly use other spreadsheets?

The Trust Score is the average of those four parts. When used in a 2025 RevOps study, it cut data-checking delays by 28% and boosted analytics adoption by 19%, all within a year and a half.

Practical Recommendations for RevOps Leaders

Audit trust failures directly. Map where stakeholders distrust systems, which dashboards face the most scrutiny, and where manual verification recurs. Trust friction reveals the weak points that accuracy metrics alone cannot surface.

Create a shared metric glossary for the most crucial GTM metrics. Include the definition, source system, key rules, owner, and change history for each one. Show this to everyone, and make it a requirement to review it before getting access to the executive dashboard.

Build cross-functional data governance. Form a working group with representatives from RevOps, sales operations, marketing operations, and finance. Define change-control processes and require that all substantive changes are communicated before they affect operational reporting. Organizations with complete alignment between finance and IT are 5.5 times more likely to report full confidence in their data.

Monitor continuously. Set service-level indicators for key revenue metrics, automate freshness and anomaly checks, and treat data quality like application performance. Catching structural errors in real time prevents downstream sales impact before it registers in the pipeline.

Reliable Data Is the Actual Competitive Advantage

Data volume is no longer the differentiator. Most B2B companies already have way more data than they know what to do with. The big issue isn’t about having enough data; it’s whether the people making decisions trust that data enough to actually use it.

The organizations that thrive are the ones that invest in data trust architecture treat trust as infrastructure, not a by-product. Every measurement needs to be clearly defined and understood by everyone involved. When you treat trust as something concrete and build systems around it, teams start seeing how reliable their data is right in their workflow. This means no more wasting time; like 3.8 weeks per quarter just checking numbers, are needed before moving forward.

The organizations that will lead in the next phase of B2B intelligence are not those collecting the most signals. They are those who have built the infrastructure to verify, govern, and confidently activate the data they already have.

Reliable data is not a luxury. It is the foundation for every strategic advantage that follows.

Business professional reviewing dashboards and reports to improve B2B data prioritization and identify high-value GTM signals

B2B Data Prioritization: The GTM Signal Problem

Modern GTM teams are not losing to data scarcity, they are losing to a failure of B2B data prioritization. The average sales team now has access to 12.7 data sources per account and 47 individual data points per prospect. Cold outbound conversion rates remain at 2.3%, while time-to-close has increased 18% over two years. More data is not producing better decisions. It is producing slower ones.

Data does not make for better decisions; data makes for slower decisions.

A 2024 audit on 40 revenue GTM teams found that 68% of data points in CRMs remained unused for routing, sequencing, or scoring decisions. 82% of enrichment fields were used only for display, never for decision-making. 41% of intent-driven campaigns did not adjust their cadence, content, or offer based on the intent signals they purchased. Organizations are collecting data they never act on, and treating the data they do act on as if every signal carries equal weight.

That assumption, that all data matters equally, is one of the most expensive operational errors in modern B2B go-to-market design.

What B2B Data Prioritization Actually Means & Why It’s a Revenue Question

B2B data prioritization is not a data quality effort. It is a revenue design question.

A field or signal is high priority not based on its cleanliness or completeness, but rather if it makes a GTM decision better, correlates with pipeline results, and impacts behavior measurably. And by that definition, very little of what populates a CRM would fit.

An effective operational model breaks down data into three categories:

Critical data directly predicts conversion probability or accelerates deal velocity. This includes verified buying intent signals, budget authority indicators, active technology evaluations, organizational triggers such as funding events or leadership changes, and decision-maker contact accuracy. When these signals disappear, pipeline degrades. They deserve immediate enrichment, real-time validation, and primary placement in every workflow.

Secondary data provides context and supports personalization but does not independently trigger action. Industry vertical, company size, historical engagement patterns, and secondary technographic layers all belong here. They improve outreach quality once Tier 1 data has confirmed an opportunity is worth pursuing. They should inform messaging, not prioritization sequencing.

Low-value data has weak or zero correlation with conversion in your specific sales model. Outdated firmographics, bulk contact scrapes, generic website visit history, and intent topics misaligned with your product category fall into this tier. Closed-won regression analysis is the clearest diagnostic: any field appearing in fewer than 15% of won deals with no measurable velocity impact should be deprioritized or retired.

The distinction between these tiers is not academic. One SaaS company tracked data consumption across their SDR team and found that reps reviewed an average of 23 fields per prospect during research. Closed-won analysis showed only 6 of those fields correlated with conversion. Across 1,200 monthly outreach targets, the 17 irrelevant fields cost 78 hours of productive selling time per month.

Why B2B Data Prioritization Fails: Three Structural GTM Breakdowns

Three structural failures prevent B2B data prioritization from taking hold in most organizations.

The first is volume without filtering. A 2024 benchmark study, by Syncari, of 90 B2B GTM stacks found the median team maintained 72 data fields per account, integrated 12 external data sources into CRM or a CDP, and ran 8 or more scoring or segmentation layers. Enrichment APIs add another 15-20 attributes automatically, with no built-in mechanism to filter by revenue relevance. When teams are overwhelmed, they fall back to defaults: relying on a single composite score without understanding which signals drive it, or building sequences on arbitrary “enriched accounts” lists that treat every record as equally actionable.

The second failure is the absence of prioritization frameworks. Most organizations categorize data by source or type rather than business impact. CRM fields display alphabetically or by creation date. Without a formal taxonomy of critical versus secondary versus low-value data, decisions about what to track and act on are made ad hoc. One demand generation manager described the problem directly: “Our enrichment workflow triggered on 18 data points. Marketing automation scored leads using 12 attributes. But pipeline regression showed only 4 fields mattered: employee headcount, technology stack category, funding stage, and intent topic strength. We were enriching 78% unnecessary data at $0.40 per API call.”

The third failure is strategic misalignment. A cybersecurity vendor purchased an intent data platform tracking over 400 topics, then routed every account showing any intent signal to sales. SDRs received leads researching “what is endpoint protection” alongside accounts actively evaluating vendors. Of 2,800 monthly intent-flagged accounts, only 47 became qualified opportunities, a 1.7% conversion rate. The platform cost $78,000 annually. Effective cost per qualified intent lead: $1,660. The problem was not the data. It was the absence of prioritization logic distinguishing genuine evaluation signals from low-value educational research.

The Volume-vs-Accuracy Trade-Off: Why More Signals Undermine GTM Data Prioritization

One of the most consequential misconceptions in B2B intelligence is that broader coverage improves outcomes. It often does the opposite.

Volume-centric data strategies attempt to possess a record for every account in a market. The result is high data decay, diluted accuracy, and signal overload. A database that is 90% complete but architecturally flat, where a funding alert carries the same weight as a LinkedIn page view, produces less actionable intelligence than a smaller, validated dataset of genuinely in-market accounts.

The trade-off is illustrated best in intent data. Without any filters, when intent signals are directed toward the sales department, the conversion rates are drastically affected by volume. You can read more here.

A martech platform that had been using Bombora had been directing 400 intent flagged leads each month to the SDR department. However, after introducing topic relevance scoring and surge intensity filters, only 80 leads were qualified to be contacted right away. The conversion rates shot up from 3.1% to 11.8%.

The Data Impact Velocity Matrix, a framework for evaluating incoming signals along two dimensions, business impact factor and decay velocity, formalizes this logic. Direct contact points such as verified direct-dials and corporate emails score high on both dimensions: they are critical for conversion and decay at roughly 30% annually as professionals change roles. Active intent signals score highest on decay velocity, with a buying window of two to six weeks, making immediate routing essential. Firmographic data decays slowly and warrants only quarterly or biannual batch enrichment. Generic context data, such as aggregate office locations or company news feeds, adds minimal value and should be suppressed from primary execution systems entirely.

A Revenue-Aligned B2B Data Prioritization Framework

Effective B2B data prioritization requires a scoring model that connects data attributes to revenue outcomes rather than data availability.

The Priority Score formula weights four components: conversion correlation (40%), decisional influence (30%), data freshness (20%), and enrichment cost efficiency (10%). Conversion correlation measures the statistical relationship between attribute presence and closed-won status. Decisional influence captures how frequently the attribute appears in qualify or disqualify decisions, measured through CRM workflow analysis. Data freshness scores recency inversely, with a 90-day refresh scoring 1.0 and data over 365 days old scoring 0.2. Enrichment cost efficiency captures revenue generated per dollar spent acquiring that data point.

Attributes scoring above 75 receive automatic enrichment and primary CRM visibility. Scores between 40 and 75 enrich conditionally based on account fit. Below 40: exclude from standard workflows.

This process was adopted by another software company, which found out that “active job postings” had been classified under Tier 1 because of its high correlation with growth and purchasing power potential. However, the quarterly assessment showed that correlation levels went down from 0.68 to 0.34 because of the effects of hiring freezes on the target market population. Consequently, job postings were re-classified under Tier 2 and the company shifted its focus to changing the technology stack that now correlated at 0.71.

Operationalizing B2B Data Prioritization: Four Mechanisms That Drive Pipeline

Tiered enrichment workflows replace universal enrichment with conditional logic. High-fit accounts with strong ICP match and buying signals trigger comprehensive enrichment across all Tier 1 and Tier 2 fields. Medium-fit accounts enrich Tier 1 only. Low-fit accounts receive minimal enrichment sufficient for disqualification confirmation. A healthcare IT company applied this approach across 1,400 monthly leads. Previous universal enrichment cost $3,920 per month. Tiered enrichment cost $2,156, a savings of $1,764 monthly, while improving data relevance for the accounts that actually mattered.

CRM field prioritization restructures how information is surfaced to sales reps. A primary view displays only Tier 1 data, six to eight fields, and serves as the default. Secondary views add contextual fields. Complete views include everything but require deliberate access. One implementation reduced average CRM page load time by 40% and increased Tier 1 data review rates by 63%, measured through field-click tracking in Salesforce analytics.

Intent signal filtering applies topic relevance scoring and surge-intensity thresholds to separate genuine evaluation activity from low-value research behavior. High-priority intent routes to immediate SDR follow-up. Medium-priority feeds nurture campaigns. Low-priority intent remains in the database but triggers no workflow action. This filtering, not intent data quality, is what determines whether intent platforms deliver pipeline.

Prioritization calibration on a continuous basis is performed using closed-won analysis at a quarterly rate, focusing on those attributes that recur most often in winning opportunities and those that have lost relevance due to changes in the market environment. Data significance is dynamic; attributes that contribute to conversions today can cease to be relevant tomorrow.

Practical Recommendations for RevOps Leaders

Run a data-relevance audit before investing further in enrichment, this is the foundation of any B2B data prioritization effort. List every data source, field, and signal your GTM systems consume. Calculate a relevance score for each using impact on pipeline, usage rate across routing and sequencing workflows, and statistical predictive power. Any field that has not driven a routing or sequencing decision in 90 days is not Tier 1.

Reduce data overload by deprecating low-value fields in execution systems. One organization reduced their enrichment map from 87 fields to 18 core decision-driving fields. Pipeline and velocity held flat. Data maintenance overhead dropped by 40%. Less active data is not less intelligence. It is cleaner execution.

Map each Tier 1 signal to a specific GTM action. A funding alert should trigger SDR outreach within 24 hours. A decision-maker job change should route to account-specific sequencing. An active pricing page visit should elevate an account’s intent score above the workflow threshold. If a signal cannot be mapped to a specific action with a measurable expected outcome, it is not Tier 1.

Build workflows around four to eight high-value fields rather than comprehensive data sets. One RevOps team found that using only four prioritized firmographic and intent fields in routing increased pipeline from high-value accounts by 23%, while fields kept for display only with no routing logic had no measurable impact.

Review priority areas on a quarterly basis. With changes in GTM strategy, there is a need to shift priorities. Have quarterly review sessions to ensure asset recategorization, reweighting of signals, and obsolescence of uncorrelated data fields.

Conclusion: Revenue Belongs to the Focused, Not the Comprehensive

The competitive edge in B2B intelligence is not moving toward organizations with the most data. It is moving toward organizations with the clearest understanding of which data drives decisions and which data consumes attention.

Implementing B2B data prioritization typically improves research efficiency by 30-45%, reduces enrichment costs by 25 to 40%, and increases conversion rates by 15 to 30% by concentrating sales capacity on genuine buying signals. These are not marginal gains. They are the operational difference between a GTM system that compounds efficiency and one that compounds complexity.

Not all data deserves equal attention. Most data deserves none at all. The organizations that outperform will not be those that collected the most signals. They will be those that built the discipline to know which signals to act on, which to archive, and which to stop buying entirely.

Digital analytics dashboard visualizing performance metrics and insights related to B2B data cost efficiency and revenue optimization

The B2B Data Cost Efficiency Problem: Why Data Spend Does Not Correlate with Revenue Outcomes

B2B data cost efficiency has become one of the most overlooked levers in modern revenue operations. The average B2B company now spends $178,000 annually on data solutions and subscriptions; 34% more than three years ago, while pipeline velocity has dropped 8% and conversion rates have flatlined.

In a benchmark study conducted in 2025 among 150 data-driven B2B organizations, it was discovered that only 28% of firms which had a 42% rise in data expenditure were able to improve their revenues per sales rep. This is not an execution failure. It is a structural one.

The B2B data market has expanded into a fragmented ecosystem where the average company manages 15 or more separate data vendors. When 72% of sales teams pay for data features they never activate and 76% of RevOps organizations do not track revenue impact by data source, the problem is not a lack of information. It is a lack of efficiency.

The core issue: organizations optimize for data volume while ignoring data utility, activation rates, and alignment with actual go-to-market (GTM) execution.

Why Higher Data Spend Kills B2B Data Cost Efficiency

Each of these failure modes degrades B2B data cost efficiency in a distinct way.

The Three Recurring Failure Modes

Higher spend concentrates around three recurring failure modes, each compounding the others.

Redundant vendor purchases inflate costs without expanding coverage. Most revenue organizations run six to twelve data tools simultaneously: a primary database, enrichment API, technographic layer, intent platform, email verification service, and point solutions for specific verticals. These platforms frequently pull from the same upstream data brokers. A 2025 analysis of 40 sales-stack audits found that 73% of companies had at least two independent enrichment vendors, and 56% had two or more intent platforms. Yet only 31% could confidently identify which vendor drove materially better outcomes.

One middle-tier SaaS firm with Cognism, ZoomInfo, and Apollo running simultaneously saw that 47% of its target account contacts were common to all three platforms. The combined annual spend on these tools totaled $143,000. The unique coverage achieved because of this overlap: 8%. The additional spend amounted to $67,000 annually with zero pipeline value.

The Utilization and Alignment Gap

Low activation rates silently destroy ROI. The industry average for database utilization sits at 12% to 18%. Organizations purchase enterprise licenses based on projected coverage needs but activate only a fraction. A healthcare technology firm was able to quantify this in great detail – its $92,000 yearly investment in enrichments equated to 840,000 API calls. Post-enrichment analysis revealed that 340,000 API calls were enriching contacts who were scoring below the client’s minimum ICP threshold, and 190,000 calls were enriching contacts tagged “do not contact” or in dormant segments for 18 months. Utilization: 37%

GTM misalignment converts quality data into expensive noise. Data purchases often proceed independently of strategy changes. Sales teams buy databases optimized for outbound at scale while the company pivots to account-based strategies. Marketing acquires intent signals for accounts that SDRs are not assigned to. When data outputs live in dashboards instead of playbooks, routing rules, or performance targets, spending on data without changing behavior changes nothing.

Volume vs. Accuracy: The Data Efficiency Trade-Off That Shapes Pipeline ROI

The instinct to purchase larger databases is understandable but consistently counterproductive. Volume creates an illusion of capability while masking the cost of poor quality.

Consider two scenarios. A company with 80,000 CRM records spending $90,000 annually on data, with a typical usability rate of 35%, pays $3.21 per usable record. A smaller database of 40,000 records with 55% usability costs just $2.50 per usable record. Volume is not value. It is a larger surface area for the same underlying problems.

This trade-off intensifies with intent signals. Intent data is one of the biggest drivers of modern data spend and one of the least efficiently used. Organizations ingest thousands of unstructured third-party signals weekly without internal filters. An enterprise software firm might receive an alert that a target account is searching for “cloud security,” but if the provider cannot identify which business unit is executing that search, sales teams cold-call generic contacts. The result is low conversion, wasted capacity, and data spend that drives activity without driving revenue. You can read more here.

High-accuracy, lower-volume datasets consistently outperform high-volume generalized databases in pipeline contribution. One financial services company spent $67,000 on an 18,000-contact healthcare vertical database. Six months later, it generated $180,000 in pipeline from 11 accounts, all of which were already known and engaged. Meanwhile, their underfunded enterprise motion produced $4.2M in pipeline from a $12,000 investment in executive intent data targeted at existing customers in expansion phases. Precision won by a factor of 35 on pipeline ROI.

The Data Activation Matrix: Measuring B2B Data ROI Across Every Vendor

Most organizations lack formal efficiency metrics for data investments. That gap prevents optimization. Three metrics, tracked together, that form the foundation of any B2B data cost efficiency framework and expose where value erodes.

Cost Per Usable Record (CPUR) reveals the true price of quality. The formula accounts for total investment against records that actually meet accuracy and delivery standards:

CPUR = (Tool Cost + Labor Cost + Decay Cost) / (Number of Records * Usability Ratio)

An organization investing an extra $14,000 in tools for improving data quality but lowering the cost associated with labor by $10,000, as well as boosting usability from 55% to 78%, will lower its cost per record usage from $2.50 to $1.89. This is compounding data infrastructure.

Cost Per Activated Account (CPAA) measures GTM alignment. For an account to count as activated, it must enter a meaningful sales motion, not just exist in a list or scoring dashboard. This metric exposes inefficiencies where data is purchased at scale but activation rates remain low, or where one vendor shapes actual plays while another is ignored despite similar contract value.

Pipeline Impact Per Dollar of Data Spend is the most strategic metric and the hardest to calculate. It requires tagging pipeline by data source and comparing performance against a baseline. Organizations that attempt this consistently find that a minority of vendors drive the majority of incremental pipeline, and that some high-cost “table-stakes” products produce no measurable lift when removed.

A useful triage framework maps vendors across two dimensions: value (pipeline generated per dollar) and efficiency (CPUR or CPAA). Vendors that are low-value and low-efficiency are candidates for elimination. High-value but low-efficiency vendors merit closer scrutiny and usage optimization. High-value, high-efficiency vendors deserve consolidation of spend and negotiating leverage.

Four Shifts That Recover 25-40% of Wasted Data Spend

Organizations that improve B2B data cost efficiency follow a consistent approach.

Focus on a core-with-specialties approach. Replace the patchwork of multi-vendor systems with a layered approach consisting of one general vendor that provides coverage overall, plus one or two specialty vendors with differentiating capabilities such as deep verticals, international reach, or intent signals. By focusing on two vendors as opposed to seven, a logistics software company was able to lower its costs from $156,000 to $89,000 while improving contact uniqueness coverage by 12%.

Route inbound leads through a low-cost validation layer first: check for valid email format, filter personal domains, remove duplicates. Only verified enterprise leads proceed to premium API enrichment. This ensures high-cost API credits are spent on viable, sales-ready opportunities rather than junk sign-ups or personal email addresses.

Build performance-based vendor evaluation into renewal cycles. Measure accuracy rate, data freshness, and pipeline correlation for every vendor, updated quarterly. Vendors scoring below a defined threshold enter performance review. Vendors that cannot demonstrate measurable pipeline contribution should not receive automatic renewals. This approach prevents incumbent inertia, the tendency to renew underperforming vendors due to switching friction.

Embed data into GTM workflows rather than adjacent to them. Scoring, routing, sequencing, and playbooks must be driven by data, not informed by it after the fact. A 2025 case study found that a 25% increase in the fraction of SDR time spent on data-driven accounts led to a 19% increase in pipeline per salesperson with no change to the underlying data budget. The efficiency gain came from usage, not volume.

Data Cost Efficiency Is the GTM Competitive Advantage

The modern GTM environment is not short on data. It is short on economically effective intelligence systems.

Organizations that keep increasing their number of records, suppliers, and data signals without getting better at activating and making decisions based on data will experience increasing expenses and inconsistent commercial results. Organizations focused on B2B data cost efficiency; not just data volume, consistently recover 25-40% of wasted spend.

The recovered capital, often $50,000 to $150,000 annually, funds higher-impact revenue initiatives with measurable ROI.

Data cost efficiency is not a procurement metric. It is a revenue strategy. The question is not whether your data budget is large enough. It is whether your data investment is actually changing decisions, improving execution, and driving pipeline that closes.

Business professionals reviewing analytics reports and charts to assess B2B data lifecycle management and identify where data loses value over time

The Data Lifecycle Breakdown: Where Data Loses Value Across Its Journey

There are 100,000 customers in your CRM. Your marketing automation system measures millions of actions. Your data warehouse holds years of transaction history. Yet effective B2B data lifecycle management remains elusive: salespeople cannot identify decision makers, marketing campaigns miss targets, and forecast numbers fall short. The problem isn’t data quantity, it’s how data degrades across the B2B data lifecycle stages from collection to activation.

Research shows that poor data quality costs B2B organizations an average of $12.9 million annually, with 73% of enterprise data losing 47% of its value as it moves from collection to activation. For RevOps leaders, this represents a systematic revenue drain that compounds at every stage.

The Six-Stage B2B Data Lifecycle Management Framework

Effective B2B data lifecycle management requires understanding that data doesn’t lose value at a single point. It degrades continuously across six distinct stages, each presenting opportunities for value preservation or deterioration.

Collection

Collection establishes the foundation. Whether data enters through form fills, API integrations, or third-party providers, initial capture determines maximum potential value. Industry analysis reveals that 68% of collected data lacks contextual relevance despite 94% technical accuracy. A form capturing job title without role function or buying stage limits downstream utility regardless of processing quality.

Processing

Processing transforms raw inputs into structured formats through deduplication, normalization, validation, and field mapping. Validity’s 2024 report found that 25% of B2B contact records contain critical errors introduced during processing, not at collection. When transformation rules fail to handle input variety, “IBM,” “International Business Machines,” and “IBM Corp” create separate account records, fragmenting engagement history and account intelligence.

Storage

Storage preserves data integrity and accessibility. Architecture determines whether historical context remains available when needed. Research indicates that 60% of Tier 1 data remains untouched for over 90 days, consuming expensive storage for dormant records. The critical failure is context loss. When storage systems don’t preserve enrichment timestamps, teams can’t distinguish stale intent signals from current buying behavior.

Enrichment

Enrichment adds external context that enhances decision-making. Forrester research shows that organizations using intent data see 20% higher conversion rates, but only when signals remain recent (under 14 days) and contextually relevant. Generic intent scoring that flags “technology interest” isn’t actionable. Specific signals like “evaluating Salesforce competitors” enable precise outreach. The coverage versus accuracy dilemma persists: one B2B company reduced enrichment costs by 40% by eliminating 11 low-usage fields and reinvesting in higher-quality technographic data sales actually referenced.

Activation

Activation converts stored data into action through lead routing, email sequences, opportunity scoring, and account identification. Data value follows an exponential decay curve once activation conditions are met. InsideSales research shows response rates are highest within 4 hours of a trigger event, drop 35% after 24 hours, and fall below baseline after 72 hours. Yet most systems operate on batch processing, creating systematic activation delays that erode value even when upstream processes work perfectly.

Maintaining

Maintaining sustains the value of your data by doing things like updates and deletions. Your B2B database tends to depreciate at a rate of 22.5-30% per year due to changes in jobs and mergers of companies. Failure to maintain your list results in bounced emails and ineffective campaigns.

Where Data Lifecycle Breakdowns Destroy Pipeline Value

Value erosion compounds across stage transitions. A pipeline intelligence analysis showed accounts collected with 94% hygiene processed into 91% accurate enrichment and stored for 89% query coverage, but activation delivered only 47% ICP-relevant signals to SDRs. By maintenance, intent scores decayed 28% quarterly, costing $4.1 million in pursuing invalid opportunities.

The collection breakdown

The collection breakdown occurs when organizations optimize for volume over signal quality. A SaaS company might capture 10,000 inbound leads monthly with 95% email deliverability yet see only 8% MQL conversion because forms don’t capture buying stage, budget authority, or implementation timeline. Salesforce research found that 70% of B2B buyers fully define requirements before engaging vendors. Collection systems that don’t identify where prospects are in this journey create misalignment between sales readiness and outreach timing.

The processing breakdown

The processing breakdown fragments intelligence across systems. One enterprise software company discovered that processing errors created 18% duplicate account records, causing sales teams to unknowingly multi-thread 1 in 5 target accounts with conflicting messaging. When “Head of Marketing” maps differently across systems, segmentation outputs conflict and prioritization becomes unreliable.
You can read more here.

The storage breakdown

The storage breakdown trades query speed for historical context. When contact records show current job titles but not previous roles, sales teams can’t identify job changes, a buying trigger that increases close rates by 30% according to LinkedIn data. A healthcare company implementing proper tiered storage moved 95% of patient records to lower-cost tiers, reducing monthly storage costs by 52% while maintaining compliance.

The enrichment breakdown

The enrichment breakdown layers on data without evaluating utility. Coverage metrics advertise database size, but a contact database with 90% email deliverability and only 40% accuracy on buying committee roles fails enterprise sales requirements. Enrichment vendors updating only 70% of records create uneven data quality that introduces bias into segmentation and scoring models.

The activation breakdown

The activation breakdown creates timing value decay. A mid-size company tracked that leads waited 18 hours for enrichment processing, 6 hours for scoring rules to run, and 4 more hours for routing logic to execute. This 28-hour delay destroyed conversion potential. When a prospect downloads a competitive comparison guide, every hour of delay reduces response rates and pipeline probability.

The maintenance breakdown

The maintenance breakdown allows quality to degrade invisibly. One company audited infrastructure and found 14 terabytes of duplicate customer records, outdated lead files, and orphaned CSV exports. Their annual storage bill exceeded $47,000 for data nobody accessed. Without validation processes and monitoring, organizations operate blind to accumulating waste.

The Data Lifecycle Value Preservation Framework

High-performing B2B data lifecycle management teams optimize value flow across transitions rather than stages in isolation. This requires measuring value retention at each handoff point.

Metrics at stage level set baselines for performance: collection signal-to-noise ratio (portion of fields used in qualification), processing deduplication efficiency, storage query latency at P95, field usage rate in enrichments, median time to route for activations, and refresh schedule versus recommended intervals.

Cross-stage value measurement links decisions made at earlier stages to their outcomes.When collection forms change, measure not just completion rates but 30-day conversion impact. When enrichment vendors change, track sales qualification efficiency. This creates feedback loops optimizing for business outcomes rather than isolated KPIs.

Bottleneck identification reveals where data spends time without value addition. If the median lead waits 14 hours in enrichment queues but only 2 hours in scoring, enrichment is the constraint. If 60% of leads fail activation due to missing phone numbers but collection forms don’t require them, collection is the bottleneck.

Threshold-based activation preserves value by eliminating unnecessary processing steps. Instead of enriching all leads to 100% completeness before routing, route immediately on three intent signals and enrich asynchronously. An enterprise software organization was able to drop time to first sales touch from 31 hours to 4.5 hours.

Practical Recommendations for RevOps Leaders

Audit your complete process lifecycle. Map each stage and measure value drop per transition. Industry data suggests siloed systems achieve 47% end-to-end value preservation compared to 91% for integrated lifecycle approaches. The gap represents recoverable pipeline opportunity.

Define stage-level SLAs. Collection relevance above 94%, processing yield above 91%, storage freshness under 7 days, enrichment precision above 87%, activation utilization above 94%, and maintenance decay below 3% monthly. Lifecycle value equals the minimum stage SLA because the weakest link governs revenue impact.

Implement tiered storage. Move data not accessed in 90 days out of expensive Tier 1 storage. Automated policies for archiving reduce costs while maintaining accessibility for legitimate future use.

Prioritize activation velocity over enrichment completeness. Data value isn’t determined by quality at rest but utility in motion. An 80% complete record activating within 4 hours of a trigger event drives more pipeline than a perfectly accurate record reaching sales three weeks after showing buying intent.

Build continuous validation into workflows. When an SDR flags a bad number, that signal should flow back to maintenance and collection stages instantly. The automated system detects the depletion in enrichment levels at 18%, day 7 as against day 47.

Master Data Lifecycle Management for Revenue Impact

The degradation rate of data due to natural decay is 30% per year. But lifecycle breakdowns accelerate erosion to 53%, destroying $4.1 million in pipeline effectiveness for a typical mid-market organization.

RevOps leaders who master data lifecycle management in B2B understand that not all data needs perfection before activation, that coverage matters less than relevance, and that speed often creates more value than completeness. The organizations that win don’t hoard the most data. They manage the journey with intentionality at every stage, preserving actionable intelligence from collection through activation.

Because in 2026, perfect activation on decayed data wastes cycles. Lifecycle intelligence compounds pipeline value continuously.

Business professional analyzing multiple dashboards and analytics screens to transform raw information into actionable data context for GTM intelligence

Data Context: Transform Raw Data Into GTM Intelligence

You have 50,000 contacts in your CRM. You process millions of behavioral events in your data warehouse. There are 247 active leads on your dashboard. But your salespeople still can’t tell when customers are ready to purchase. Your marketing campaigns seem generic. And your forecasts are still a shot in the dark.

The problem isn’t data volume, it’s data context. Without context, even accurate data produces no results.

Industry statistics show that up to 80% of all enterprise data is never leveraged because it lacks any kind of context. People just aren’t able to apply this data into meaningful action. That’s the problem with data context, data that is accurate yet unable to produce results simply because it’s not contextualized within the business process and decision-making.

GTM is one area where this challenge makes an immediate impact.

What Data Context Means for GTM Teams

Data context consists of three interconnected layers that transform raw information into intelligence: Why is this data important? To whom does the data apply? And how should this impact on their decision-making process?

The business relevance layer connects the data to your unique GTM strategy. The significance of someone holding the director’s title varies in different organizations. A fundraise event will only have implications for expansion only if your product helps enterprises scale. Without such context, firmographic details such as industry and company size lack precision for segmenting customers.

The role context layer defines where a person fits in the buying decision process. Is the individual an influencer, decision-maker, or end-user? What is the significance of the same title in small firms versus large corporations? A VP of marketing role holds entirely different responsibilities when compared between a Series A startup and Fortune 500 company.

Usage context determines when and how data should trigger action. A product usage spike indicates expansion readiness only if it follows adoption of key features. A job change matters only if the new role has budget authority. Intent signals without buying stage context lead to misguided outreach.

As one analysis explains, without semantic definitions mapping business terms to precise data, teams improvise. They see a customers table and assume every row is a customer. These assumptions are wrong often enough to make systems unreliable.

Where Data Context Breaks Down in RevOps

The data context gap appears in four predictable areas across revenue operations.

Generic datasets provide standardized fields and broad coverage but not business-specific relevance. A typical B2B database delivers company size, industry, and job titles without growth stage, technology stack, or buying intent. According to analysis of intent data evolution, first-wave intent failed precisely because it lacked persona-level precision needed to identify actual buying group members. Sales received lists of hot accounts with no context on who to call or what their role-specific pain points were.

Lack of segmentation means treating all contacts within a title cohort as identical. Marketing targets all Marketing Managers without filtering by industry, company size, or intent. The result is diluted messaging and lower engagement.

Absence of linking prevents understanding relationships between data points. A funding announcement without hiring data does not indicate expansion capacity. A job change without company growth context does not signal authority. In most cases, there is intent data on one platform, technographic data in another, and the CRM history on yet another. In this case, because there is no connection between all these points, you may be seeing someone visiting the pricing page when they have just created a support ticket.

Over-reliance on raw fields leads teams to depend on individual attributes instead of derived insights. Using job title alone misses the value of combining role, influence level, and buying stage into a composite signal.

How Missing Data Context Impacts GTM Performance

Missing context cascades through every revenue function.

Poor targeting results from treating all accounts within firmographic bands as equal. Without growth stage, technology fit, and intent context, marketing campaigns reach companies that cannot buy. Sales teams prioritize accounts that will not convert. Campaigns targeting all Marketing Managers without context include low-fit segments, producing diluted messaging and lower conversion rates.

Weak prioritization means all leads receive equal treatment. High-value accounts get ignored while low-potential prospects consume resources. Without scoring based on intent plus fit, pipeline quality suffers. One analysis notes that without access to complete context, execution breaks down. A hyper-growth customer showing early churn signals needs proactive outreach before they start evaluating alternatives. None of these plays work effectively without deep, unified context about the account.

Ineffective decision-making follows from incomplete intelligence. A lead score based solely on engagement volume misses whether the engaged contact is a decision-maker. A territory plan based solely on company count misses growth trajectory. Leaders might allocate more budget to the region with the most leads, not realizing another region has leads with much higher contextual fit.

Operational inefficiency emerges when large datasets are processed without context. Low signal quality means wasted effort and increased customer acquisition costs. Scaling raw data without context leads to more noise, not more insight.

A Framework for Building Data Context in Your Stack

Building effective data context requires a four-layer approach:

Layer 1: Raw Data includes contacts, accounts, activities, and signals. It has high volume but low inherent meaning.

Layer 2: Enrichment adds firmographics, technographics, and intent signals to increase data depth. According to 6sense analysis, data enrichment solves the context problem by filling gaps and adding context that turns skeletal records into complete, actionable profiles.

Layer 3: Context transforms data into ICP alignment, account tiers, buying stage, and role relevance through scoring models, segmentation frameworks, and relationship mapping. This is where most teams stop at enrichment but high performers invest in true context because enrichment adds data while context adds meaning.

Layer 4: Decision connects data to actions, workflows, and campaigns through lead routing, outreach triggers, and prioritization queues.

According to the evolution of intent data, the fundamental shift is how data is used. Intent data is now the engine of signal-based revenue operations. When a high-value signal is detected, modern systems can trigger a nurture sequence, send an instant notification to the BDR, and populate an ad audience.

Making Data Actionable in GTM Systems

Adding context is necessary but insufficient. Context must be integrated into workflows to drive action.

Align with business goals before adding context. Every dataset should answer how this impacts pipeline. As one Chief Data Officer learned, data initiatives fail when they exist in isolation. The approach changed when they stopped treating data as a separate function and started embedding it directly into business strategy.

Integrate into workflows so context triggers action. Ensure data feeds into CRM actions, campaign triggers, and sales prioritization. Context viewed in reports is unused. Context embedded in CRM records, alert workflows, and campaign segmentation drives action.

Facilitate interpretation on a large scale with semantic layers to determine meaning. Avoid unnecessary analysis by offering explicit signals and pre-classified data types. Ensure consistency with standardized logic for all applications, including artificial intelligence, business intelligence, and analytics.
You can read more, here.

Strike a balance between coverage and relevance. Data quantity does not guarantee quality decision-making. Prioritize meaningful data over sheer numbers.

Data Context Implementation: RevOps Best Practices

Audit data usage. Identify which data fields actually influence decisions. Most organizations discover they are enriching for volume rather than decision-critical attributes.

Define context models explicitly. Create clear frameworks for ICP, segmentation, and prioritization. Build a semantic layer that defines what key terms mean for your business. Active lead, qualified account, and expansion opportunity must have precise, shared definitions.

Layer intent on top of fit. Firmographic fit tells you who could buy. Intent context tells you who is ready to buy now. Without both, prioritization remains guesswork.

Reduce raw data dependency. Shift from field-level analysis to derived insights. Create scores, categories, and segments instead of depending on individual attributes.

Standardize context across teams. Ensure consistent definitions and unified usage. When different teams operate from different contexts, marketing builds campaigns around generic personas while sales discovers actual decision-makers in conversations.

Measure context effectiveness. Track conversion improvements, targeting accuracy, and pipeline quality to validate that context is driving business outcomes.

Conclusion: Data Context Transforms Raw Data Into Revenue

Raw data is potential. Context is activation.

The organizations that scale successfully are not those with the most data but those that add the most relevant context, transforming fragments into insights, records into relationships, and signals into pipeline.

In modern GTM systems, data collection is easy and enrichment is scalable. But context remains the differentiator. Organizations that solve the data context problem move from noise to signal, from activity to efficiency, from data to revenue.

The question is not whether you have enough data. The question is whether you understand what it means. Because without context, you do not have intelligence. You have noise.

Professional analyzing unstable data dashboards highlighting the data observability gap in monitoring data systems

The Data Observability Gap: Why Teams Don’t Know When Their Data Is Breaking

Dashboards are green, pipelines are working, and alerts are silent. But at the same time, you’re spending valuable time chasing down non-existent accounts, your SDRs’ days are wasted reaching out to bad leads, and your forecast accuracy rate has gone down by 41%. This is a case of invisible data corruption. It happens quietly and costs businesses an estimated $12.9 million per year. Data corruption is one of the main reasons why almost 42% of enterprises stated that more than half of their AI initiatives were postponed or failed, according to a survey conducted in 2025 among 401 data leaders.

Most organizations monitor infrastructure religiously. They track CPU usage, memory consumption, and API response times. But they do not monitor their data, the actual asset driving decisions. This is the data observability gap, and for revenue operations teams managing seven and eight-figure pipelines, it represents an invisible tax on every strategic choice.

What Data Observability Measures (And Why the Gap Exists)

Data observability extends beyond traditional system monitoring. It answers not “Is the system running?” but “Is the system producing reliable outputs?”

The distinction matters. A CRM sync might complete successfully while dropping 15% of contact updates. An enrichment job processes on schedule but only covers 60% of records due to API limits. Intent signals arrive with 72-hour delays. No errors trigger. No alerts fire. The damage compounds silently.

The Five Critical Dimensions of Data Observability Gap

Freshness measures how recent data is and whether updates arrive on time. In B2B, an intent signal loses value rapidly. If latency jumps from 5 minutes to 5 hours, the data has failed even if the pipeline succeeded.

Volume tracks whether expected amounts of data flow through systems. A sudden spike or flatline typically indicates broken tracking pixels or failed API integrations. A daily enrichment job that processes 40% fewer records than baseline has failed, regardless of technical completion status.

Distribution catches problems that do not violate rules but distort reality. If 35% of your pipeline typically comes from enterprise accounts and suddenly shifts to 55%, you face either a market breakthrough or a segmentation failure. When email open rates jump 40% overnight, you probably have a tracking implementation break, not an engagement miracle.

Schema monitors structural integrity. When the “Industry” field starts receiving job titles, your schema has drifted. When a data provider shifts existing values from a “size” field to “legacy_size” without notification, your segmentation rules execute against empty fields. No errors appear. Your ICP targeting just stops working.

Lineage provides the audit trail from source to dashboard. When conversion rates look wrong, lineage allows you to trace back through transformations to find exactly where logic failed. According to SiriusDecisions research, 25% of B2B organizations cannot trace how their lead scores are calculated, making silent failures nearly impossible to diagnose.

Four Data Observability Failures Hiding in Revenue Pipelines

Revenue teams operate with broken data longer than they realize because observability gaps manifest in ways that evade standard monitoring. Each of the following failure modes is a direct symptom of the data observability gap.

Silent schema drift occurs when upstream systems change structures without notification. A data provider modifies their taxonomy, now categorizing directors as “management” instead of “leadership.” Your lead scoring model continues executing perfectly. Results become meaningless. Detection happens quarters later when reviewing win rates by segment.

Gradual decay masquerading as variance presents as normal fluctuation. Email bounce rates creep from 3% to 11% over eight months. Each week feels within range. No single day trips an alert. But the cumulative impact; thousands of unreachable prospects, declining sender reputation, contaminated lists, represents material revenue leakage with no definitive break moment.

Transformation logic failures emerge when business rules and data reality diverge. Marketing automation shows 450 MQLs this quarter. CRM reports 520. Your data warehouse calculates 475. Each system is internally consistent. Each team defends their number. Revenue forecasts built on any of them are equally wrong, but no error appears in any log.

Cross-system inconsistency creates multiple versions of truth. One enterprise SaaS company discovered their entire Q3 demand generation budget targeted accounts using an enrichment feed that had not updated industry classifications in 14 months. Their “high-growth fintech” segment was actually legacy financial services companies that had since pivoted or been acquired.

The Revenue Cost of the Data Observability Gap

The business cost of the data observability gap concentrates in three areas.

Pipeline inefficiency manifests when teams operate on degraded data. If 20% of contact information is outdated and systems cannot flag which 20%, reps either waste time on dead ends or spend resources re-verifying everything. Salesforce’s 2023 State of Sales report found that reps spend 72% of their week on non-selling activities, with data quality issues consuming the largest share. For a 50-person sales team, a 10% reduction in selling time from bad data represents roughly $2.1 million in lost productivity annually.

Misallocated GTM spend occurs when targeting relies on corrupted signals. Intent data with 48-hour latency gets treated as real-time, causing marketing to engage prospects after buying windows close. Firmographic data with 35% accuracy drives ABM campaigns to wrong personas.

Delayed problem detection compounds every other failure. The leader of revenue operations in a Series C firm found that they were using inaccurate information to make important business decisions due to an error in their pipeline reports, which had been going on for five months without the team’s knowledge. Deals that got synced from Salesforce to the warehouse were somehow getting filtered out of the report depending on where they stood in the pipeline process.

How to Close the Data Observability Gap: 5 Operational Steps

Implementation requires structured measurement across the data lifecycle.

Define data health metrics explicitly. Do not rely on implicit assumptions. Set tolerable fill rates, freshness levels, and accuracy standards for mission-critical resources. A contact record fit for newsletter segmentation might not suffice for sales campaigns. Measure data quality on factors that count: completeness of the fields needed for engagement, freshness of enrichments (job title updated within 90 days), credibility of signals (intent scores with proven accuracy >70%).

Implement automated anomaly detection. Track expected distributions and trigger alerts when patterns shift. If firmographic coverage typically holds at 90% and drops to 65%, high-value accounts are being excluded from campaigns. Manual checks do not scale. Deploy statistical or machine learning-based detection for volume, freshness, and distribution anomalies.

Create centralized visibility dashboards. These are not engineering dashboards showing server metrics. Such metrics include:

“Freshness of contact information for Q1 target customers: 78% refreshed within 30 days” or
“Latency of intent signal: Median 8 hours, 95th percentile 26 hours.”

Firms having unified dashboards measuring data health have a fourfold higher ability to detect problems than those that depend on reactive reports from users.

Assign clear ownership with defined protocols. Revenue operations typically owns CRM data integrity, sales owns account and opportunity data, marketing owns campaign and engagement data. Each owner needs authority to reject bad data. When anomaly detection flags a 25% drop in daily contact imports, documented protocols should specify who gets alerted, investigation SLAs, and rollback procedures.

Integrate observability into workflows. Before campaigns launch, reporting, and before scaling, validate data readiness, data integrity and data reliability respectively. Track mean time to detection (MTTD) and mean time to resolution (MTTR) for data incidents. Improving these metrics is the goal of observability.

The foundation of revenue growth strategy is having a unified RevOps data infrastructure.

Why Closing the Data Observability Gap Is a Strategic Advantage

The data observability gap is not about systems going down, it is about broken data continuing to drive decisions undetected.

Fixing pipeline inefficiency is impossible if you can’t see that 30% of contact data is stale. Optimizing conversion is impossible when you don’t even know your lead scoring broke six weeks ago. And if you can’t quantify the revenue impact of current failures, you’ll never justify data quality investments.

For revenue leaders, the observability gap represents a fundamental strategic vulnerability: flying blind while believing you can see. Based on industry standards, data problems may affect between 20-30% of all operational data pipelines at any given moment, yet without causing any failure points. These problems go unnoticed for a long time, which means that decisions are being made based on inaccurate data.

Data maturity’s next step is not about having more data, using more tools, or creating additional dashboards. The focus should be on improving data visibility. Because targeting depends on accurate data, prioritization depends on timely data, and conversion depends on relevant data.

Organizations implementing comprehensive observability see measurable improvements. Full-stack observability reduces outage costs by 37% and mean time to recovery by 50%. Research shows 51% of organizations report achieving a 2-3x ROI on their observability spend.

Closing the data observability gap is the next step in data maturity and the most underdiscussed competitive advantage in modern GTM.

Professional managing big data systems illustrating data ownership accountability challenges in organizations

The Data Ownership Problem: Why No One Is Accountable for Data Quality

Your CRM shows a deal at 90% confidence. The forecast meeting confirms it. Two weeks later, the deal is dead. When you investigate, you discover the contact left the prospect company three months ago. The champion never existed. The 90% number was hope, wearing a spreadsheet. This is what happens when data ownership accountability doesn’t exist. No one is responsible for verifying the data quality that your revenue forecast relies on.

According to IBM’s Institute for Business Value, 43% of chief operations officers consider data quality as their primary concern, with more than one-quarter estimating losses of over $5 million annually. Gartner pegs the average at $12.9 million annually. But why does this issue continue to exist when nobody owns the data?

If data management is everyone’s responsibility, then it will be nobody’s priority. Marketing owns lead generation. Sales owns CRM updates. RevOps owns systems. External vendors own enrichment. Each team influences data quality, but no single team controls it end to end. The result is a GTM engine built on shifting sand.

What Data Ownership Accountability Actually Means

Data ownership accountability is frequently mistaken for data access. Data access does not necessarily imply data ownership. It implies accountability along three key axes.

Data quality ownership requires accountability for data accuracy, completeness, and timely updates for specified data types. If address information is incorrect, an individual can be held accountable for correcting them. This includes defining what “good data” actually means and maintaining standards for formatting, validation, and mandatory fields.

Data update responsibility means someone ensures records remain current. When a contact changes jobs or a company shifts technology stacks, ownership dictates who detects that change and updates the system. Without this, data becomes stale even if initially accurate.

Data governance responsibility means someone defines and enforces the rules. Standards for entry, modification, duplication resolution, and compliance require accountable stewards. DemandLab notes that no single group owns revenue data, but “what is owned is the primary responsibility at each phase of the revenue cycle.”

The underlying concept is straightforward. Ownership of data implies accountability for results, not merely processes. When the quality of data is compromised, the owner determines who is accountable, what necessary actions to take, and how to measure performance.

Why Data Ownership and Accountability Fail in B2B

The accountability gap emerges from predictable structural failures. Without clear data ownership accountability, these problems compound across every revenue function.

Cross-team dependencies create the primary problem. B2B data flows across multiple functions. Marketing generates leads. Sales qualifies them. Customer Success manages relationships. When data quality requires coordination across silos with competing incentives, no single team prioritizes it. Research from Integrate and Demand Metric found that over 60% of teams report poor data disrupts lead handoffs and slows sales productivity.

Unclear role definitions compound the issue. The majority of companies lack clear ownership of contact vs. account data, who is responsible for validation of the enrichment process, and who is accountable for duplicate management. How can we know whose record in the CRM, MAPs, and data warehouse is accurate if there is disagreement among them? Without clarity, the issue never gets sorted out.

Lack of governance structures means accountability is assumed rather than assigned. Many teams rely on informal processes, manual fixes, and reactive cleanup efforts. There are no defined standards, validation rules, or enforcement mechanisms. One industry study found that 84% of organizations struggle with inaccurate or duplicate data precisely because they lack formal quality measures.

Vendor dependency creates a false sense of security. Organizations often assume the data vendor ensures quality. In reality, vendors optimize for coverage, not precision. Accuracy varies by segment and geography. Data degrades after delivery. Without internal ownership, vendor data becomes unverified input that teams trust until it fails. A data procurement framework is a must.

The GTM Cost of Unowned Data

The absence of ownership creates compounding inefficiencies across every revenue function.

Inconsistent data quality means standards vary across teams. Enrichment is applied inconsistently. Validation is sporadic. This leads to unpredictable performance and three versions of truth. The sales department claims revenue is X. The finance department believes it is Y. The operations department has its own figure.

Unsolved errors mount up silently because no one is answerable for fixing them. Problems are deprioritized. Duplicate records can reach 10% to 30% of customer databases in organizations without data quality initiatives. Each duplicate means wasted outreach, confused reporting, and damaged customer experience.

Operational inefficiencies become normalized. Salesforce estimates that reps spend up to 27% of their time dealing with data issues instead of selling. Teams spend hours manually reconciling conflicting data. Sales reps begin “shadow researching,” ignoring the CRM and going to LinkedIn to manually verify every prospect. This is a massive waste of high-value labor that could be avoided with clear ownership.

Broken prioritization and targeting affect ICP alignment, lead scoring accuracy, and intent signal reliability. If data inputs are inconsistent, prioritization models produce misleading outputs. Intent signals point to churned contacts. Enrichment delivers 92% accuracy but only 61% becomes usable.

The IBM research found that data quality issues often go unnoticed because their impact appears downstream as lost revenue, not at the point of failure. Pipeline leaks. Conversion rates weaken. Sales cycles lengthen. The impact is not isolated. It affects the entire revenue system.

A Framework for Data Ownership Accountability

Building data ownership accountability requires a structured approach to assigning and enforcing ownership.

Domain ownership defines what is owned. Assign ownership by data domain: contact data, account data, enrichment data, intent signals. Each domain should have a clear owner. For example, RevOps owns contact enrichment and is accountable for 82% connect rates. Demand Gen owns intent signals and is measured on 35% progression lift. The data team owns firmographics with a 92% ICP match target.

Lifecycle ownership defines when it is owned. There must be ownership at each level: ingestion (data input and acquisition), enrichment (enhancement and verification), activation (usage within campaigns and routing), and maintenance (upgrades and cleaning). Ownership can be assigned to different groups for each step, but transition protocols should be clear.

Outcome ownership defines why it is owned. Ownership is validated through results, not activity. Define ownership based on outcomes such as data accuracy rates, contactability metrics, ICP fit consistency, and campaign performance impact. Most organizations assign ownership at the process level. High-performing organizations assign ownership at the outcome level.

Operationalizing Data Ownership

Moving from theory to practice requires embedding ownership into daily workflows and performance systems.

Data SLAs (service level agreements) define expected quality levels. For example, you must maintain contact data with greater than 90% deliverability, enrich data within defined intervals, and meet accuracy thresholds. SLAs make quality measurable and non-negotiable.

Quality benchmarks provide objective targets. Monitor the metrics of bounce rate, duplication rate, enrichment match rate, and ICP alignment. The fundamental criteria include accuracy, which should be 98% or more, completeness at 95% or more, consistency of 97% or more, timeliness of 99% within 24 hours, and uniqueness at 99% or more.

Performance tracking ties data quality metrics to team KPIs, operational reviews, and performance evaluations. Regular scorecards show each domain’s quality metrics against SLAs. When quality drops below thresholds, automated alerts trigger owner intervention. Include data integrity in performance reviews and reward the “data citizens” who actively improve the system.

Workflow integration ensures ownership is maintained during execution. Embed validation into CRM processes through required fields and validation rules. Build automated checks into enrichment pipelines. Use campaign readiness filters to prevent unowned data from reaching execution. Before any outreach deploys, validation confirms that required fields meet quality thresholds. Data ownership accountability must be embedded into daily workflows, not treated as a one-time project.

As one data governance framework emphasizes, “without accountability, measures become shelfware. Each critical data element should have both a data steward responsible for data quality rules and a system owner accountable for implementation.”

Practical Recommendations for RevOps Leaders

Start with a clear gap analysis. Map current ownership structures, which likely reveals that no one truly owns critical data domains. Calculate the quality cost using the $2.7 million annual benchmark for mid-market companies. Identify your top three pain points, typically bounce rates, duplicates, and stale intent signals.

Define ownership explicitly. Identify the owners of each data domain, the accountable parties at each phase of the lifecycle, and the criteria for measuring success. Apply a RACI model to assign ownership roles: accountable party, responsible party, and consumer (utilizes the data).

Prioritize those data domains that will make the biggest difference. Contact accuracy, relevance of roles, account-level data, and intent signals will make the largest contribution to the bottom line and will produce the quickest ROI from ownership.

Align ownership with revenue outcomes. Measure data quality based on pipeline contribution, conversion rates, and sales efficiency rather than just technical accuracy metrics. This ensures ownership drives business results.

Decrease dependence on vendors. Verify vendor information internally. Do not delegate responsibility. Establish continuous feedback cycles that utilize performance metrics like bounce rate and connect rate to detect problems with data and update validation criteria.

Conclusion: Data Quality Improves When Ownership is Clear

Typically, most B2B companies are concerned with getting better data, enriching it, and enhancing the technology. However, none of this works without proper ownership. This is not a technological challenge, but rather an organizational one.

What is needed is a paradigm shift to data ownership accountability; from shared responsibility to clear ownership, from process metrics to outcome measurement. And infrastructure only performs when someone is accountable for maintaining it.

You need to ask not whether you can afford data ownership, but whether you can afford to continue without it. With each passing day that this ambiguity continues, your data deteriorates, your decision-making skills deteriorate, and money flows out of your hands. Because ultimately, it is ownership that improves your data.

Professional presenting analytics dashboard illustrating the need for a data obsolescence strategy in evolving data systems

Data Obsolescence Strategy: Why Every Dataset Needs One

Every B2B organization needs a data obsolescence strategy. Your data warehouse contains every lead interaction over the last seven years, and some customer records date to 2018.

Yesterday, a member of your analytics department spent three hours fixing a report that included prospects from the past five years completely forgetting to compare that data with any actual contacts that changed organizations. While the analysis from that report has no value, the opportunity loss caused by mistakes made while creating it does. A structured data obsolescence strategy prevents this waste.

Poor data quality costs organizations an average of $12.9 million annually. MIT Sloan Management Review research indicates companies lose 15 to 25% of revenue due to bad data. 85% of companies attribute bad decision-making directly to stale data. B2B contact data decays at 2.1% per month, meaning 70% of your database becomes unreliable within three years. Yet most organizations treat 7-year-old prospect records identically to seven-day-old intelligence.

Storage is cheap. Confusion is expensive. Data that outlives its relevance does not become neutral. It becomes a liability that pollutes decision systems, degrades model performance, and creates governance problems. This is the problem that data obsolescence planning solves.

The True Cost of Ignoring Data Obsolescence Strategy

How Stale Data Creates Conflicting Analytics Insights

When current and historical data coexist without clear temporal separation, analytics systems generate contradictory outputs. An old firmographic record classifies an account as a small business. A new record reflects its growth into an enterprise. Both sit in your pipeline. Your segmentation engine pulls from both. Your marketing team and sales team draw different conclusions from the same system and neither trusts the other’s numbers.

This is a huge issue for those who rely on buyer intent signals and account intelligence. If prospects showed interest as an intent signal six months ago, then those figures may no longer be valid if the buying committee completely overhauled, if they added new line items to the budget, or if they changed strategic priorities.

Therefore, your team may still be pursuing opportunities that disappeared five or six months back due to not having any sort of method to identify and rule out these types of stale signals.

Preventing ML Model Drift Through Data Expiration

Machine learning models trained on historical data perform poorly when underlying patterns shift. A lead scoring model built on 2021 buying behavior fails in today’s market where decision cycles, committee sizes, and evaluation criteria evolved substantially. Harvard Business Review research shows many ML models lose 20 to 30% predictive accuracy within months when training datasets are not continuously refreshed.

Organizations using AI-driven lead prioritization face a specific vulnerability here. When models ingest firmographic and technographic data that is eighteen months old, they produce high scores for stagnant companies and low scores for rapidly scaling prospects. The model appears to function while generating outputs that consistently mislead the sales team.

Reducing Compliance Risk with Data Expiration Policies

Every retained record demands governance attention: backup, security, audit inclusion, and compliance tracking. UK private sector researchers found that businesses saved 41% of stored data without a business reason, costing an estimated 3.7 billion pounds annually. Individual businesses average 213,000 pounds in annual storage and management spending, much of it on data that they should have discarded years ago.

For B2B organizations managing contact data across jurisdictions, the regulatory exposure compounds. GDPR’s data minimization principle requires retaining only what is necessary for stated purposes. Fines for serious violations reach 17.5 million pounds or 4% of global turnover. An organization holding seven years of accumulated personal data carries far more exposure than one with a disciplined expiration strategy.

Three Types of Expiration Policy

Time-Based Expiration

The simplest and most common approach: data expires after predetermined periods reflecting typical useful lifespan. Contact enrichment data refreshes every 90 days. Behavioral engagement signals expire after 180 days. Campaign interaction logs archive after one year. Intent signals carry a 60-day active window before decay weighting reduces their influence to zero. Organizations implementing time-based policies report 30 to 40% reductions in active data volumes without material impact on analytical capability, because the expired data provided minimal ongoing value.

Event-Based Expiration

Some data should expire based on business events, not calendar time. A prospect’s intent signals expire the moment they sign with a competitor. Firmographic records trigger re-enrichment following an acquisition. Technographic datasets reset when a company migrates its technology stack. Contact enrichment refreshes automatically when someone detects a job change.

Event-based policies align data lifecycle with business reality. When deals close as won or lost, granular interaction history loses operational relevance. The aggregate learning matters. The contact-level detail does not.

Relevance Scoring: Advanced Data Obsolescence Control

The most sophisticated approach uses measurable signals to determine when data has passed its useful life. Has anyone accessed this record in the past year? Does it score above minimum thresholds in your ICP model? Does any active campaign or model reference it? Records falling below defined relevance thresholds trigger expiration regardless of age or events. At Packed Data, we establish the foundation of the refresh velocity model: we continuously score intent signals and technographic data and automatically expire them when they fall below the threshold required to inform a meaningful sales decision. The goal is a database where every active record is worth acting on.

How to Operationalize Your Data Obsolescence Strategy

Building an effective data obsolescence strategy requires three operational components:

Automated Data Archival for Continuous Hygiene

Manual data cleanup is not done consistently, as most teams don’t want or have enough time to do this consistently. Automated archival processes remove expired data from the active environment to a long-term storage or archival solution based on predefined procedures, and these solutions execute automatically without any human interaction.

Organizations who have implemented automated archival systems typically have experienced 25 to 35% improvement in query performance as the size of the active data set shrinks to only those records that are operationally relevant. In one case, a retail organization, which automated its archival process, experienced a reduction in data storage costs of 60% along with a 45% increase in query speed.

Tiered Storage: Cost-Efficient Data Lifecycle Management

Not all data that has reached its end of life requires hard deletion. As relevance decreases, the system will migrate tiered storage through increasingly lower-priced tiers until the data is either permanently deleted or reaches its end of life (EOL). Active operational data remains in fast performance databases (millisecond query speed), while recently expired data gets archived into standard cloud storage (low cost). Older historical data moves into cold storage (archival storage). Permanent deletion occurs only after all required legal retention periods have been satisfied.

By managing the various categories of storage and retention obligations through a tiered storage strategy, you can optimize the cost of storing data while retaining the ability to recover that data if needed, comply with data retention obligations, and prevent compliance-related data from adversely affecting operational analytics.

Managing Access Controls for Expired Data

Active systems manage archived data differently from how they manage current data. When there are no access restrictions, analysts might mistakenly include expired records in analyses, training data sets, and reports. Utilize the concept of least privilege for accessing archived data (sales and marketing should only access current intelligence, and analytics should receive only recent historical data to perform trend analysis; compliance should receive full archives when the retention period is mandated). By having expiration date and tier meta tagging on each record will make the enforcement of access systematized rather than manual.

Data Obsolescence Strategy ROI: The Business Case

A B2B SaaS organization that implemented a structured data obsolescence strategy across its account intelligence database reported storage costs dropping from $180,000 to $65,000 annually, lead scoring accuracy improving from 72% to 93%, decision velocity increasing by 25%, and $5.4 million in incremental revenue attributed to cleaner targeting. A fintech firm that refreshed eighteen-month-old firmographic data recovered $3.7 million in ARR from accounts that had been misrouted to wrong territories.

The compliance benefits add up alongside the financial results. Automatic expiration can lead to up to 80% less exposure to personal data and it also halves the time required for audit preparation. In 2024, the average costs of data breaches were $4.88 million and companies that have well-established data governance programs have breach costs that are 45% lower. Each record that is deleted means one less exposure to data breach risk.

Building Your Data Obsolescence Strategy: First Steps

Start your data obsolescence strategy with these practical steps. Conduct a staleness audit. Take a sample of 500 records from your current CRM/account intelligence database and determine when they were last validated. You will want to flag anything greater than 90 days old for contacts, greater than 180 days for intent signals, and greater than 12 months for firmographic data. The percentage of records that do not meet these thresholds is your current level of obsolescence.

Define expiration policies for your three highest-volume data types. Build time-based rules, identify business events that should trigger re-enrichment or expiration, and set the relevance thresholds that mark a record as no longer actionable. Automate enforcement so the system maintains itself.

Packed Data’s continuous enrichment model is built on this principle: enrichment is not only additive. It overwrites what is old. The CRM integration for sales intelligence acts as a constant filter, identifying contacts who left their companies, accounts that changed their technology stacks, and intent signals that aged past the point of actionability. The result is a database where everything present is worth using.

Data strategy isn’t only about what you collect, but also about recognizing when that data is no longer relevant.