Tag Archives: B2B data management

Line graph comparison showing fluctuations in B2B intent data accuracy and signal inflation trends

B2B Intent Data Accuracy: Stop Signal Inflation

Your sales team tracks intent data from six providers. Your CRM pulls buyer signals from twelve sources. You spent $150,000 on data subscriptions this year. Yet when your SDRs reach out to high-intent accounts, 68% of conversations go nowhere. You are experiencing signal inflation, the paradox where B2B intent data from multiple sources dilutes predictive accuracy instead of improving it.

Forrester’s Q1 2025 Intent Data Providers Wave found that 50% of companies leveraging B2B intent data report too many false positives. Forrester’s comprehensive evaluation of B2B intent data providers revealed that signal quality, not volume, determines effectiveness, with leading vendors focusing on precision over broad coverage.

When half your hot accounts turn out to be researchers or competitors, the problem is not a lack of data. It’s too much undifferentiated noise drowning genuine signals in B2B intent data.

When More B2B Intent Data Becomes the Problem

The B2B intent data market exploded over the past five years, creating unprecedented signal noise. With 70-100% of B2B marketing and sales teams now using third-party intent data, according to 2024 industry surveys, the same signals trigger alerts for hundreds of vendors simultaneously. When a prospect shows content consumption activity, they receive 36 or more vendor outreaches within two weeks, per Demand Gen Report’s 2024 Buyer Behavior Survey. The feeding frenzy creates the exact opposite of competitive advantage.

Recent predictive modeling research confirms that simple models using 10 carefully selected data series often outperform complex models ingesting hundreds of variables. The lesson translates directly to B2B sales intelligence: disciplined signal selection beats indiscriminate accumulation. As global data volume approaches 175 zettabytes, the challenge is no longer a shortage of information. It is the explosion of noise.

Four Mechanisms Driving B2B Intent Data Inflation

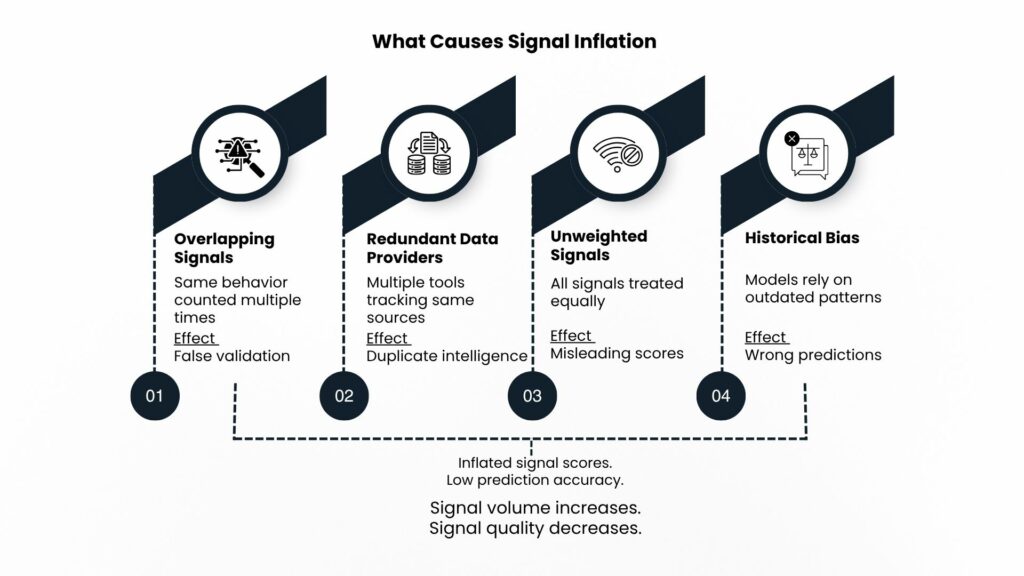
Signal inflation in B2B intent data stems from four predictable mechanisms that compound inaccuracy.

Overlapping Indicators

A prospect downloads a whitepaper tracked by one intent provider. That same download gets counted by a second provider monitoring the same publisher. Three signals from three vendors describe one behavioral event. Teams mistake redundant data for validation when they are seeing echo chamber effects. When these signals enter models without adjustment, the system overestimates buyer intent and inflates account scores.

Redundant Data Providers

Most third-party intent platforms source signals from overlapping pools: bidstream data, B2B publisher cooperatives, and the same handful of review sites. When providers claim to track trillions of intent signals, they are often tracking many of the same signals repackaged with different scoring. Subscribing to multiple vendors without de-duplication creates weighted repetition, not additional intelligence.

Unweighted Signals

A CFO visiting your pricing page three times in a week receives the same intent score as an intern downloading an educational whitepaper. Without weighting that accounts for role, recency, and engagement depth, raw signal volume creates false confidence. At Packed Data, this is exactly why the approach centers on a minimum viable signal framework: identifying the three to five core triggers that actually correlate with revenue rather than treating all activity as equally meaningful.

Historical Bias in Models

Many predictive scoring systems train on past closed deals, creating self-reinforcing cycles. If historical data shows that accounts with high content consumption converted well, the model keeps surfacing similar accounts, even as buyer behavior evolves. NetLine’s 2024 B2B content consumption report found that 25% of intent surges led to no meaningful buying activity within six months. One in four high-confidence signals produces nothing. That is not prediction. It is expensive guesswork dressed up with dashboards.

What Over-Signaling Actually Costs You

Poor B2B intent data quality creates cascading costs across sales operations.

False Positives

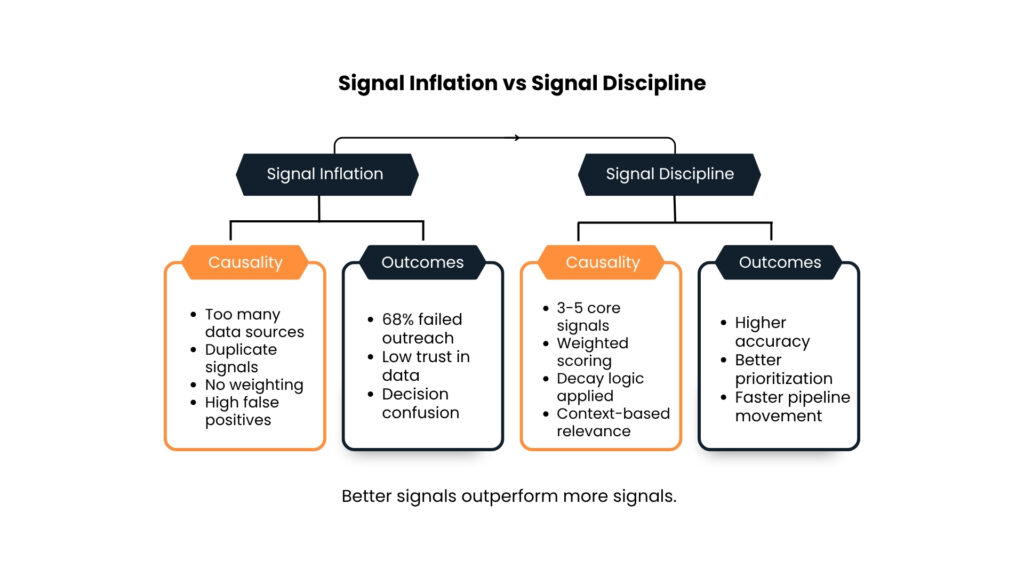
Over-signaled models surface hundreds of leads showing intent without actual buying power or technical fit. According to research on B2B intent data effectiveness, 87% of B2B teams deal with unreliable intent signals, and only 26% of those signals turn into real opportunities. SDRs chase accounts that were never in-market. Pipeline quality collapses. Credibility erodes with both buyers and the sales team itself.

Model Overfitting

When too many variables enter predictive scoring without proper regularization, models fit noise rather than genuine patterns. They achieve impressive accuracy on historical data while failing on new prospects. One SaaS organization reduced its active signals from 60 to 12 and saw scoring accuracy rise from 55% to 88%. The fewer, better-chosen signals produced a model that actually worked in the field.

Rep Distrust and Decision Paralysis

When sales teams watch high-scoring accounts go cold repeatedly, they stop trusting the intelligence system. Manual overrides reach 50% at organizations where signal quality has degraded, per Gartner research. The expensive data infrastructure becomes shelfware. At the executive level, contradictory recommendations from competing providers create a fog of war. Teams hold meetings to debate which prediction to trust. Forrester estimates decision paralysis from signal overload reduces pipeline velocity by 20%.

Building B2B Intent Data Discipline

Signal Hierarchy Frameworks

Build a hierarchy that weights indicators by predictive power. Packed Data organizes signals into three tiers.

Tier-1 covers high-signal intent and technographic data: the strongest indicators of buying readiness.

Tier-2 covers supporting firmographic context.

Tier-3 covers general behavioral signals used for background awareness only. Direct engagement, such as demo requests and pricing page visits, outweighs passive signals. This hierarchy must be explicit and consistently applied.

Decay Weighting

A technographic shift from six months ago is cold. A website visit from four hours ago is not. Effective implementations apply exponential decay: recent signals carry maximum weight, last week’s signals contribute partial influence, and anything beyond 60 days drops from active scoring entirely. Packed Data’s real-time enrichment model is built around this principle, ensuring stale data points do not artificially inflate account priority scores.

Contextual Relevance Scoring

A high-intent signal from a company with the wrong technology stack is a distraction. By integrating ICP analytics directly into the scoring model, signals are amplified only when they occur within a high-fit context. Multiple technical roles engaging integration documentation suggests active evaluation. General business content consumption suggests early awareness. These are not equivalent, and your model should not treat them as though they are.

Human-in-the-Loop Validation

Automated models catch scale. Humans catch context. Regular feedback loops where sales reps flag poor leads allow models to learn the difference between a real signal and noise specific to your industry. Hybrid approaches combining AI predictions with expert validation consistently outperform either pure automation or purely manual analysis. A rep’s ability to downvote a lead teaches the system what generic intent actually looks like in your market.

What Signal Discipline Delivers

Higher trust in intelligence: When scores consistently align with outcomes, sales teams use them. Win rates on accounts targeted through disciplined intelligence are double those from generic outbound prospecting. Trust becomes self-reinforcing as successful conversions refine models.

Fewer false alerts: Teams using intent data strategically achieve 2.5x improvement in engagement rates compared to baseline campaigns. Buyers receive outreach only when strong signal convergence suggests genuine buying activity.

Cleaner prioritization: Organizations with disciplined signal frameworks report higher pipeline-to-close conversion rates, faster deal velocity, and larger average deal sizes. One fintech organization applying signal discipline with Packed Data’s weighted intent and technographic data saw ARR increase by $5.1 million and customer acquisition cost drop by 27%.

Sharper Intent Signals, Better Predictions

The competitive advantage in B2B sales intelligence is not who accumulates the most signals. It is who filters most effectively, weights most accurately, and maintains the discipline to ignore the majority of data in pursuit of the minority that actually predicts outcomes.

At Packed Data, the philosophy is that data for the sake of data is a liability. The goal is insight density: pre-filtered account intelligence and real-time company insights designed to simplify decision-making. CRM integrations built on this model surface the signal that matters, ensuring AI-driven prioritization rests on high-fidelity data rather than inflated noise.

Audit your current signal stack. Identify which sources overlap. Build a decay model. Establish a signal hierarchy. The organizations that sharpen their signals will outpredict and outperform those still collecting everything and trusting nothing.

Business professionals analyzing reports highlighting data blind spots in performance and decision making

The Cost of Data Blind Spots: What You Don’t See

Your VP of Sales reviews the monthly dashboard. Pipeline looks healthy. Activity metrics hit targets. Three months later, deals you counted on evaporate. Top accounts churn without warning. The quarter ends 23% below projection, yet every dashboard showed green. This is the expensive reality of data blind spots.

Research shows 42% of companies experience revenue leakage to some degree, with poor data quality costing businesses an average of $12.9 million annually. According to Gartner’s Research, organizations report that poor data quality undermines 40% of business initiatives, with financial impacts ranging from $9.7M to $14.2M annually depending on company size. Companies typically lose 5% to 15% of potential revenue due to pipeline leaks caused by unreachable prospects and invisible market changes. In the U.S. alone, poor data quality costs businesses an estimated $3.1 trillion annually.

The problem is not what you measure. The problem is what exists outside your measurements: external company changes you never detect, shadow buying committee members your CRM never captured, and parent-subsidiary relationships influencing decisions you cannot see.

The Illusion of Data Coverage

“We have dashboards for everything” represents one of the most dangerous assumptions in modern B2B organizations. Your internal systems tell you what happened within your walls: emails sent, calls logged, opportunities created. They are silent about the changes happening outside, changes that fundamentally alter your customers’ needs and your prospects’ readiness.

B2B contact data decays at 22.5-30% per year. If you are not actively refreshing, nearly a third of your supposed visibility vanishes every twelve months. Coverage and visibility are fundamentally different. Coverage means you measure many things. Visibility means you see what actually matters.

Five Data Blind Spots Quietly Draining Revenue

These five data blind spots drain revenue silently, creating invisible losses that traditional dashboards never reveal.

External Company Changes

Companies frequently merge, restructure, or pivot without a clear signal in your CRM. B2B data expires at a rate of 2.1% per month, which adds to 70% per year in high employee turnover industries. If a representative who was supporting a deal leaves the company, the deal will be quietly delayed without your team knowing for several months. Usually, sales personnel come to know about these changes, after weeks or even months, when deals become stagnant due to some factors which can be known through external intelligence from the very beginning.

Shadow Buying Groups

Your CRM lists three stakeholders. Reality involves far more. Research shows buying committees average 13 members in 2025, with the majority remaining invisible to your sales team. Your champion advocates internally but gets overruled by executives you never engaged. Technical evaluators who might be unknown to you cancel your solution because of some criteria that your team never thought of. If you don’t have buyer intent signals, you are only having a conversation with the person who claims to be the decision-maker, but not with the people who have the power to veto.

Parent-Subsidiary Influence Gaps

Your team pursues a subsidiary as an independent opportunity, unaware that parent company policies mandate specific vendors or procurement processes. You close a small subsidiary deal without recognizing the expansion potential across the enterprise parent. Research estimates 35% of B2B revenue is linked to subsidiary relationships. These dynamics unfold invisibly until deals die or renewals fail for reasons that seem to appear from nowhere.

Technology Changes Outside Your Stack

A prospect deploys new infrastructure that makes your solution incompatible. A customer migrates to platforms your product cannot support. If a prospect quietly drops a competitor’s tool or integrates a new platform that makes your solution a perfect fit, and you do not see that signal, you have missed the ideal engagement window. Packed Data surfaces exactly these technographic shifts, giving your team visibility into technology adoption before it affects deal outcomes.

Market Exits and Contractions

Companies announce that they are closing offices, cutting capital spending, or becoming financially distressed. Such events have huge implications for the revenue of the vendors who serve these companies. However, these signals are generally found in news and regulatory filings, which are quite isolated from your CRM. When your sales team gets notified by declining engagement metrics, it is usually too late – the opportunity has already been closed.

How Data Blind Spots Translate to Revenue Loss

Each blind spot creates a specific and measurable category of revenue damage.

Missed Upsell Windows: Customer environments evolve, creating natural expansion opportunities. Organizations with visibility engage during ideal buying windows. Those operating blind miss them entirely or discover them too late when budgets have already been allocated elsewhere. Research confirms companies lose $500,000 to $1.5 million in revenue simply from not reaching the right contacts at the right time.

Late Churn Detection: By the time internal usage data shows a customer disengaging, they have typically completed extensive alternative evaluation. External signals reveal churn risk far earlier: a departing champion, a funding crunch, a technology replacement. These signals predict churn months before any internal metric reflects them. Packed Data’s real-time company insights are built to surface these early warnings before it is too late to act.

Wasted Sales Cycles: Sales reps waste 27% of their possible selling time due to inaccurate data alone, which stands for 62 working days lost annually per sales rep. For example, a prospect did not have enough budget whereas your sales team got to know it only at the final stages. The decision-making power is with the parent company procurement team, but nobody has caught on to the relationship.

Misallocated Territories: Territory planning built on incomplete data sends reps after accounts that do not match ideal customer profiles while perfect-fit prospects sit ignored. Organizations persistently underperform in markets where they should win, simply because blind spots prevent effective targeting.

Finding Your Data Blind Spots: A Diagnostic Framework

Data Completeness Audits

Don’t stop at checking if a field is completed, instead check if it is accurate. One way to verify a database is to compare it with a CRM. For instance, a CRM showing a company with 500 employees while their firmographic data indicates they have grown to 2,000; this discrepancy will lead to a change in your forecast.

Packed Data advocates this as the first diagnostic step: sample 50 top opportunities and assess how many lack complete stakeholder visibility, hierarchy data, or current technology context.

Signal Gap Analysis and Internal vs. External Comparisons

Look at your last ten closed-lost deals. How many failed because of a factor that was knowable but not known? Map the signals that predict customer behavior against the data you currently capture. Do you track executive changes, funding events, technology adoptions, and market contractions? Organizations integrating external buying signals with internal engagement data improve lead qualification accuracy by 30% to 40%. Run a sample of accounts through an external intelligence source. Organizations conducting these comparisons typically discover that 40% to 70% of internal data contains material inaccuracies relative to external reality.

Closing Data Blind Spots: From Visibility Gaps to Intelligence

Closing data blind spots requires external intelligence layers and continuous enrichment strategies.

External Intelligence Layers and Continuous Enrichment

Firmographic data keeps company attributes current. Technographic data reveals technological stack changes. Intent data signals active research. Hierarchy data maps parent-subsidiary relationships. Packed Data combines these layers into a continuous account intelligence feed, turning external blind spots into internal visibility.

Batch updates are no longer sufficient. Changes in reality dictate when data needs to be updated, not when the quarter ends. AI-powered monitoring detects changes in the company, fundraising activities, and leadership changes as they occur and automatically sends updates to your CRM.

Proactive Monitoring Over Reactive Analysis

When a high-value account hires a new CTO, your sales team should know that day. When a customer adopts a competitor’s tool, customer success should receive an alert immediately. Move from asking “What happened?” to acting on “What is happening right now?” This shift requires both technology and process change. Technology provides the external intelligence infrastructure. Process ensures teams use it in daily workflows rather than reverting to decisions built on incomplete internal data.

Visibility Determines Revenue Outcomes

Revenue performance depends on the information you have at the time of making decisions. Conduct a thorough check of your data environment. Ask: What aspects of my customers do I not know? What changes have I missed? What signals are still silent?

Create a practical 90-day roadmap in the first month, review the datasets and evaluate them for completeness. In the second, integrate external intelligence layers and set up change alerts. In the third, automate enrichment pipelines with defined data freshness standards. Organizations that have closed their blind spots report revenue leakage dropping by 45% and ARR gains exceeding $4 million.

Organizations that systematically eliminate data blind spots outperform competitors who rely solely on internal metrics. The organizations that see more of the market make better decisions within it.

Professional analyzing dashboard on laptop illustrating data lifecycle management from data collection to business insights

Data Lifecycle Management: From Acquisition to ROI

Your CFO approves a $500,000 investment in a B2B intelligence platform. Marketing celebrates 50,000 new prospect records. Sales expects a pipeline surge. Twelve months later, campaigns disappoint, conversion rates stagnate, and ROI tells an uncomfortable story: that expensive data delivered minimal value.

The problem isn’t the data itself. It’s a fundamental misunderstanding of data lifecycle management; how data creates and destroys value across its entire lifespan. Most organizations track acquisition costs carefully but ignore everything after: validation overhead, activation delays, maintenance burden, and decay penalties. The result is bloated data estates, spiraling costs, and strategic insights buried under low-value information.

This is why data lifecycle management matters. Data’s value fluctuates dramatically from creation through retirement, yet most companies measure ROI at only one point. Mastering data lifecycle management is becoming a defining capability for leaders who want efficiency, growth, and real competitive advantage.

Why Data Lifecycle Management Matters: Value Changes Over Time

The traditional view treats data as a permanent asset. Once acquired, it is always valuable. That assumption is wrong.

B2B contact details can become outdated at yearly rates that vary between 22.5% and 70%. As much as 70.8% of business contacts change within a year: some people get new job titles, others change their phone numbers, and still others switch their email addresses. That pristine database purchased this quarter is largely obsolete by next year. Your balance sheet reflects no depreciation. Your pipeline does.

A buyer intent signal is highly valuable the moment it is triggered. Its value drops sharply with every hour it sits unacted upon. Conversely, historical firmographic data may have low immediate activation value but high strategic value for long-term ICP analytics. If you are not measuring value relative to time and stage, you are not managing an asset. According to IBM research, poor data quality costs organizations to lose an average of 12% of revenue due to inaccurate, incomplete, or outdated business information. and has cost U.S. businesses an estimated $3.1 trillion each year.

The Five Stages of Data Lifecycle Management

Data lifecycle management involves five distinct stages, each with unique costs and value creation patterns.

Acquisition

Data gets into your company through purchases, being internally generated, or third, party enrichment. The costs are upfront: vendor fees, integration work, storage, compliance. The value at this stage is potential, not realized. Acquisition accounts for only 15-20% of total lifecycle costs, yet this is what gets the most attention.

Collection is excessive and uncontrolled. Organizations gather far more data than they ever activate, assuming future value will justify the cost. Without clear use cases, acquisition becomes accumulation. High-performing organizations invest in targeted account intelligence instead, acquiring data aligned with specific business outcomes.

Validation

Raw data hardly ever is ready for use. Validation alters it by cleaning, deduplication, standardization, and enrichment. This phase increases the level of quality, thus the cost, and it is estimated to be around 20-30% of the total amount of money spent on the lifecycle.

An entity that puts its money into validation at the beginning of the process will gain a 30% accuracy improvement and lower maintenance costs downstream to a great extent. Validate early or pay continuously. Contact data that is 95% accurate at acquisition but left unchecked will decay to 70% accuracy within twelve months, requiring perpetual maintenance that far exceeds the upfront validation cost.

At Packed Data, validation is built into the process from the start, ensuring that when a sales rep picks up a lead, the account intelligence is genuinely actionable.

Activation

Activation is where data justifies its existence. It fuels a model, informs a decision, personalizes a campaign, or surfaces an expansion opportunity. Without activation, every prior investment is sunk cost.

According to research, companies only put to use 20-30% of the data they have obtained during the first 6 months. The remaining data is inactive, losing value and at the same time causing storage and other associated costs. The solution is to start with the purpose of data: clarify the expected business results first and then, buy the data that could most effectively help achieve those results.

Decay

All data decays. B2B data degrades at roughly 2.1% monthly, with technology sector contacts experiencing up to 50% job title changes annually. On average, sales representatives waste 27.3% of their time pursuing leads that do not convert.

Marketing campaigns suffer bounce rates that damage sender reputation even for valid contacts. If your data decays 30% annually with no refresh strategy, you are losing 30% of associated pipeline.

Organizations that manage decay effectively monitor firmographic changes, technology adoption signals, funding events, and leadership transitions in real time. Packed Data’s real-time company insights platform updates records automatically as business environments evolve, transforming static databases into living intelligence streams.

Retirement

The most neglected stage. Keeping data longer than its useful life costs you in various ways: storage capacity is used up, the security risk of each retained record is increased, the complexity of compliance requirements is multiplied, and analysts have to spend their time on very low, value noise. Retaining data out of fear generates more risk than it reduces. An organization that systematically retires data has achieved a 25-40% reduction in storage costs besides better data hygiene and easier governance.

Hidden Costs of Poor Data Lifecycle Management

Traditional ROI calculations miss substantial costs embedded across lifecycle stages, systematically underestimating total ownership costs and overestimating net value.

Over-Collection: The “more data is better” instinct leads to massive datasets with low utilization. Roughly 85% of data estates contain at least 30% unnecessary data. Collecting signals you have no plan to activate creates a storage tax that erodes the ROI of your useful data.

Under-Utilization: The most expensive data is the data you own but never activate. Research estimates 60% of datasets in typical B2B organizations remain unused. You pay full acquisition and maintenance costs for assets generating zero returns.

Maintenance Overhead: Data maintenance accounts for 30, 40% of the total lifecycle costs, but it seldom gets included in the initial investment proposals. For instance, a data purchase of $50, 000 may necessitate an annual maintenance expenditure of $75, 000, thus, the actual cost over three years is much closer to $275, 000.

Late Retirement: Data that has been scheduled for deletion is still lingering in backups, data lakes, and overlooked spreadsheets. An audit of a SaaS company revealed that 40% of its data was over two years old. Getting rid of it helped the company save $800, 000 in infrastructure costs and allowed the team to focus on leveraging Packed Data intent signals that brought in $2.4 million in new ARR.

Modeling the Data Lifecycle Economy

Cost Curves vs. Value Curves

Acquisition costs spike initially. Maintenance costs accumulate steadily over time. Value curves behave differently: many assets deliver minimal value during early processing, peak during activation when data is current and aligned with business priorities, then decline as decay progresses.

The critical insight: optimal lifecycle length occurs when cumulative value peaks, often far sooner than organizations assume. Contact data might deliver maximum value in months 3-18. Intent signals lose value within weeks if not immediately activated. Extending data lifespan through aggressive maintenance often destroys value, spending more to preserve decaying assets than those assets generate.

Identifying Negative-ROI Assets and Prioritizing High-Yield Domains

A negative-ROI asset is any dataset where total costs exceed total value created. Audit your data estate. Flag any dataset with usage below 10% quarterly and a value-to-cost ratio below 0.5. These are candidates for retirement.

High-yield data domains share four traits: clear linkage to business outcomes, rapid activation capability, extended useful lifespan, and manageable maintenance requirements. For B2B sales and marketing, research points to consistent winners:

ICP analytics identifying prospects matching successful customer patterns deliver 3-5x improvement in conversion rates.

Buyer intent signals indicating active solution evaluation compress sales cycles by 30-40%.

Technographic data revealing specific technology gaps improves engagement by 25-35%.

Contact enrichment providing decision-maker identification accelerates deal velocity by 20-30%.

    These are the domains where Packed Data concentrates its intelligence, combining AI-driven lead prioritization with real-time buyer intent signals to maximize the window of peak data value.

    Strategic Outcomes of Data Lifecycle Management

    Strategic data lifecycle management delivers three measurable outcomes.

    Leaner Data Estates

    By eliminating negative-ROI assets and retiring data promptly, organizations reduce total data volumes by 40-60% while improving average quality and business relevance. Storage costs decrease. Security risk diminishes. Analytical performance improves as algorithms process cleaner, smaller datasets.

    Lower Operational Cost

    Organizations implementing lifecycle management report 30-50% reductions in total data-related costs. These savings do not come from reduced capability. They come from eliminating waste: unused acquisitions, late retirements, and maintenance overhead on low-value assets. Marketing teams achieve better campaign performance. Sales representatives spend time on qualified opportunities. Analytics teams deliver insights faster.

    Higher Insight Density

    Lifecycle management raises the proportion of actionable intelligence over the total amount of data. Getting rid of the noise reveals the signal. Predictive models yield higher accuracy. The quality of decisions improves. If each and every potential client contact is backed up by thorough, up, to, date intelligence, then the rate of responses will be multiplied by 2 to 3 times, the duration of sales cycles will be reduced by 30 to 40%, and the rate of closing deals will go up by 25 to 35% by focusing better, not by more effort.

    From Accumulation to Strategy

    At present, the main concern is not really the quantity of data that you have. Rather, it is the value that your data produces which must be more than the cost of the entire data life.

    Implementing data lifecycle management starts with a simple 90-day audit plan. Take stock of all the data sets and mark them according to the stage of their life cycle. Model your cost and value curves. Retire low-ROI assets. Enrich and activate high-yield intelligence. Review quarterly. The leaders who treat data as a financial asset with a clear shelf life will outperform those still asking, “how much data do we have?”

    Data is not an asset you own indefinitely. It is an asset you manage continuously. The companies that outperform in the years ahead will master data lifecycle management, measuring value creation and loss across data’s entire life.