
Your VP of Sales reviews the monthly dashboard. Pipeline looks healthy. Activity metrics hit targets. Three months later, deals you counted on evaporate. Top accounts churn without warning. The quarter ends 23% below projection, yet every dashboard showed green. This is the expensive reality of data blind spots.
Research shows 42% of companies experience revenue leakage to some degree, with poor data quality costing businesses an average of $12.9 million annually. According to Gartner’s Research, organizations report that poor data quality undermines 40% of business initiatives, with financial impacts ranging from $9.7M to $14.2M annually depending on company size. Companies typically lose 5% to 15% of potential revenue due to pipeline leaks caused by unreachable prospects and invisible market changes. In the U.S. alone, poor data quality costs businesses an estimated $3.1 trillion annually.
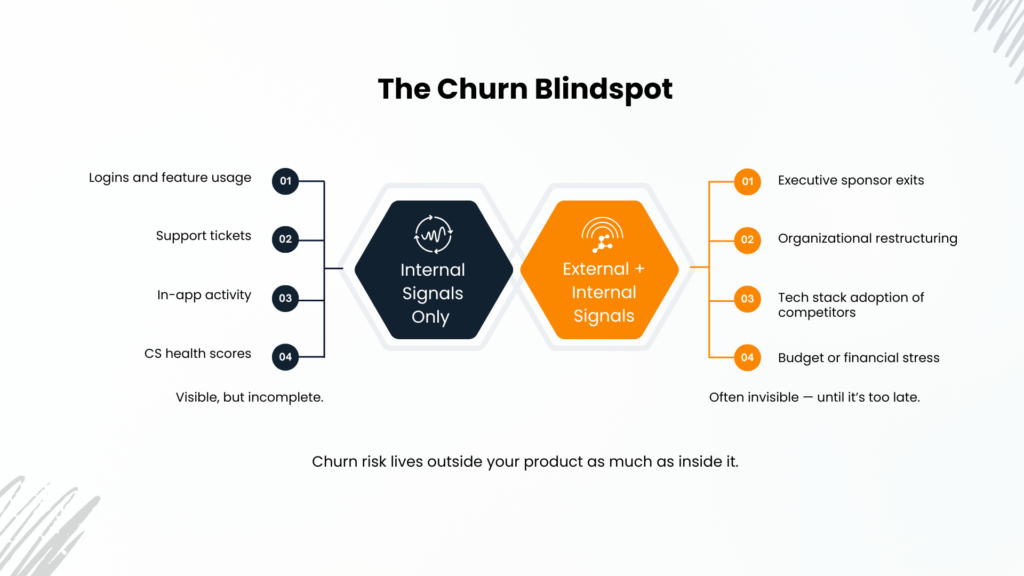
The problem is not what you measure. The problem is what exists outside your measurements: external company changes you never detect, shadow buying committee members your CRM never captured, and parent-subsidiary relationships influencing decisions you cannot see.
The Illusion of Data Coverage
“We have dashboards for everything” represents one of the most dangerous assumptions in modern B2B organizations. Your internal systems tell you what happened within your walls: emails sent, calls logged, opportunities created. They are silent about the changes happening outside, changes that fundamentally alter your customers’ needs and your prospects’ readiness.
B2B contact data decays at 22.5-30% per year. If you are not actively refreshing, nearly a third of your supposed visibility vanishes every twelve months. Coverage and visibility are fundamentally different. Coverage means you measure many things. Visibility means you see what actually matters.
Five Data Blind Spots Quietly Draining Revenue
These five data blind spots drain revenue silently, creating invisible losses that traditional dashboards never reveal.
External Company Changes
Companies frequently merge, restructure, or pivot without a clear signal in your CRM. B2B data expires at a rate of 2.1% per month, which adds to 70% per year in high employee turnover industries. If a representative who was supporting a deal leaves the company, the deal will be quietly delayed without your team knowing for several months. Usually, sales personnel come to know about these changes, after weeks or even months, when deals become stagnant due to some factors which can be known through external intelligence from the very beginning.
Shadow Buying Groups
Your CRM lists three stakeholders. Reality involves far more. Research shows buying committees average 13 members in 2025, with the majority remaining invisible to your sales team. Your champion advocates internally but gets overruled by executives you never engaged. Technical evaluators who might be unknown to you cancel your solution because of some criteria that your team never thought of. If you don’t have buyer intent signals, you are only having a conversation with the person who claims to be the decision-maker, but not with the people who have the power to veto.
Parent-Subsidiary Influence Gaps
Your team pursues a subsidiary as an independent opportunity, unaware that parent company policies mandate specific vendors or procurement processes. You close a small subsidiary deal without recognizing the expansion potential across the enterprise parent. Research estimates 35% of B2B revenue is linked to subsidiary relationships. These dynamics unfold invisibly until deals die or renewals fail for reasons that seem to appear from nowhere.
Technology Changes Outside Your Stack
A prospect deploys new infrastructure that makes your solution incompatible. A customer migrates to platforms your product cannot support. If a prospect quietly drops a competitor’s tool or integrates a new platform that makes your solution a perfect fit, and you do not see that signal, you have missed the ideal engagement window. Packed Data surfaces exactly these technographic shifts, giving your team visibility into technology adoption before it affects deal outcomes.
Market Exits and Contractions
Companies announce that they are closing offices, cutting capital spending, or becoming financially distressed. Such events have huge implications for the revenue of the vendors who serve these companies. However, these signals are generally found in news and regulatory filings, which are quite isolated from your CRM. When your sales team gets notified by declining engagement metrics, it is usually too late – the opportunity has already been closed.
How Data Blind Spots Translate to Revenue Loss

Each blind spot creates a specific and measurable category of revenue damage.
Missed Upsell Windows: Customer environments evolve, creating natural expansion opportunities. Organizations with visibility engage during ideal buying windows. Those operating blind miss them entirely or discover them too late when budgets have already been allocated elsewhere. Research confirms companies lose $500,000 to $1.5 million in revenue simply from not reaching the right contacts at the right time.
Late Churn Detection: By the time internal usage data shows a customer disengaging, they have typically completed extensive alternative evaluation. External signals reveal churn risk far earlier: a departing champion, a funding crunch, a technology replacement. These signals predict churn months before any internal metric reflects them. Packed Data’s real-time company insights are built to surface these early warnings before it is too late to act.
Wasted Sales Cycles: Sales reps waste 27% of their possible selling time due to inaccurate data alone, which stands for 62 working days lost annually per sales rep. For example, a prospect did not have enough budget whereas your sales team got to know it only at the final stages. The decision-making power is with the parent company procurement team, but nobody has caught on to the relationship.
Misallocated Territories: Territory planning built on incomplete data sends reps after accounts that do not match ideal customer profiles while perfect-fit prospects sit ignored. Organizations persistently underperform in markets where they should win, simply because blind spots prevent effective targeting.
Finding Your Data Blind Spots: A Diagnostic Framework
Data Completeness Audits
Don’t stop at checking if a field is completed, instead check if it is accurate. One way to verify a database is to compare it with a CRM. For instance, a CRM showing a company with 500 employees while their firmographic data indicates they have grown to 2,000; this discrepancy will lead to a change in your forecast.
Packed Data advocates this as the first diagnostic step: sample 50 top opportunities and assess how many lack complete stakeholder visibility, hierarchy data, or current technology context.
Signal Gap Analysis and Internal vs. External Comparisons
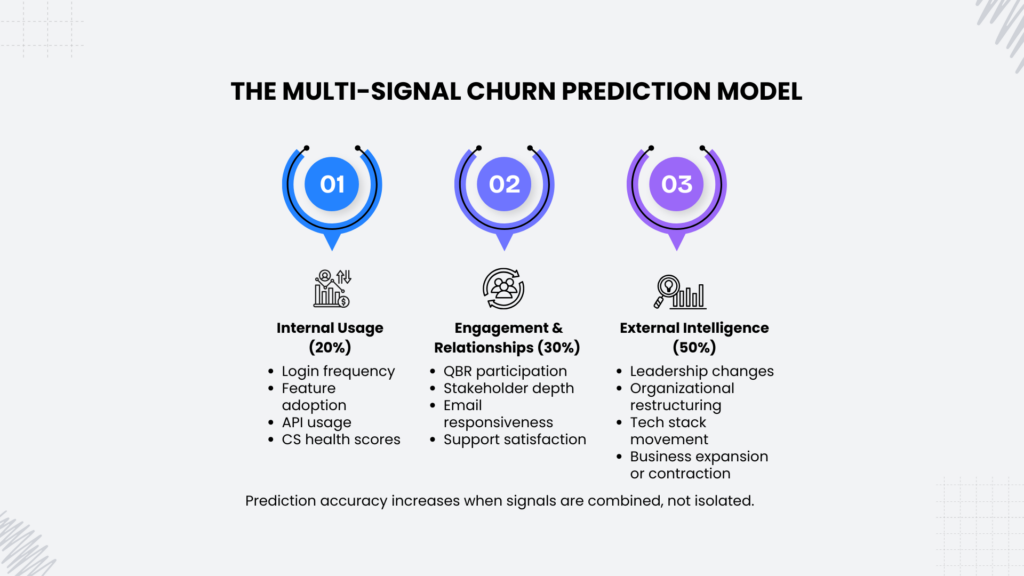
Look at your last ten closed-lost deals. How many failed because of a factor that was knowable but not known? Map the signals that predict customer behavior against the data you currently capture. Do you track executive changes, funding events, technology adoptions, and market contractions? Organizations integrating external buying signals with internal engagement data improve lead qualification accuracy by 30% to 40%. Run a sample of accounts through an external intelligence source. Organizations conducting these comparisons typically discover that 40% to 70% of internal data contains material inaccuracies relative to external reality.
Closing Data Blind Spots: From Visibility Gaps to Intelligence
Closing data blind spots requires external intelligence layers and continuous enrichment strategies.
External Intelligence Layers and Continuous Enrichment
Firmographic data keeps company attributes current. Technographic data reveals technological stack changes. Intent data signals active research. Hierarchy data maps parent-subsidiary relationships. Packed Data combines these layers into a continuous account intelligence feed, turning external blind spots into internal visibility.
Batch updates are no longer sufficient. Changes in reality dictate when data needs to be updated, not when the quarter ends. AI-powered monitoring detects changes in the company, fundraising activities, and leadership changes as they occur and automatically sends updates to your CRM.
Proactive Monitoring Over Reactive Analysis
When a high-value account hires a new CTO, your sales team should know that day. When a customer adopts a competitor’s tool, customer success should receive an alert immediately. Move from asking “What happened?” to acting on “What is happening right now?” This shift requires both technology and process change. Technology provides the external intelligence infrastructure. Process ensures teams use it in daily workflows rather than reverting to decisions built on incomplete internal data.

Visibility Determines Revenue Outcomes
Revenue performance depends on the information you have at the time of making decisions. Conduct a thorough check of your data environment. Ask: What aspects of my customers do I not know? What changes have I missed? What signals are still silent?
Create a practical 90-day roadmap in the first month, review the datasets and evaluate them for completeness. In the second, integrate external intelligence layers and set up change alerts. In the third, automate enrichment pipelines with defined data freshness standards. Organizations that have closed their blind spots report revenue leakage dropping by 45% and ARR gains exceeding $4 million.
Organizations that systematically eliminate data blind spots outperform competitors who rely solely on internal metrics. The organizations that see more of the market make better decisions within it.