

Three enterprise accounts decided not to renew their contracts with your company in the same week. Three enterprise accounts decided not to renew their contracts with your company in the same week. Each account paid $200,000 per year. That’s $600,000 in lost annual revenue. Sales scrambles to replace it. Finance revises quarterly forecasts downward. After careful analysis, you discovered that each account had several indicators months before they cancelled: An executive sponsor left. Product usage decreased. Support tickets dropped to zero. But none of these indicators were visible until too late. You needed customer churn prediction intelligence.
Most B2B companies don’t lose customers suddenly. They lose them over time through many missed signals, lost relationships, and unnoticed account changes occurring over several months. On average, B2B organizations don’t recognize a customer is leaving until 30-45 days before cancellation. By this time, 80% of churn decisions have already been made, making them impossible to reverse. Customer churn prediction intelligence changes this by identifying at-risk accounts 6-9 months earlier.
The negative financial impact of customer churn is significant. According to industry data, it costs 5-7 times more to acquire a new customer than it does to keep an existing customer. Yet many organizations invest significantly more in customer acquisitions than in proactive customer retention efforts, of which they do not have any forewarning.
The Churn Blindspot
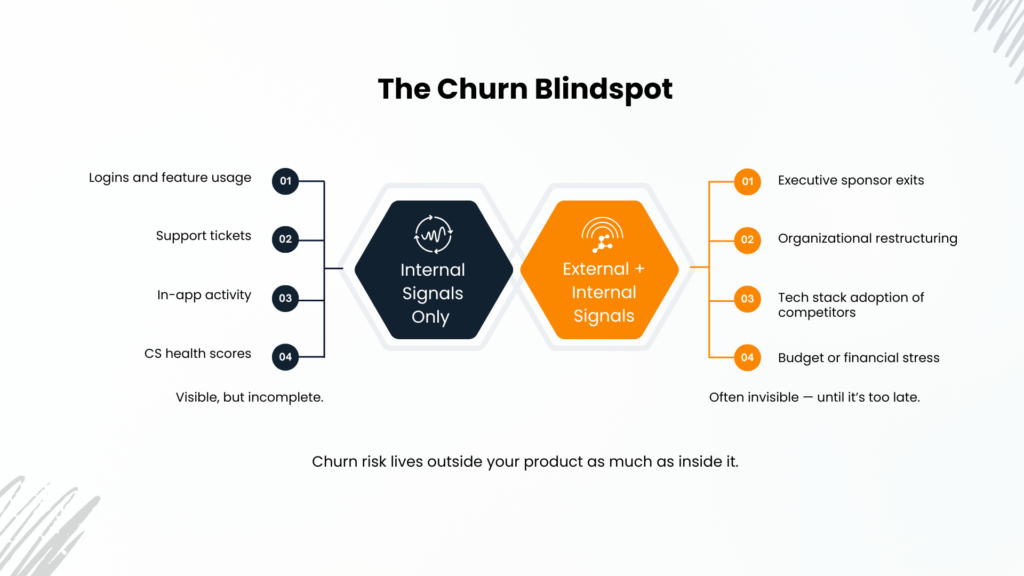
Customer success platforms monitor login statistics. Which features get used. How many support tickets open. But they miss what’s happening outside their platform. Executive champions leaving. Competitors getting adopted. Financial difficulties hitting. Customer churn prediction intelligence combines internal and external data.
For example, when the executive champion(s) who signed the contract for the company’s solution leaves the organization; if the organization begins using a competitor’s solution; if their organization is experiencing financial difficulties. By combining these external indicators with usage data, organizations can build predictive churn models and identify at-risk accounts 6 to 9 months prior to a termination event allowing them to have significant intervention timeframes to retain those customers.
Thus, the primary issue of today’s churn problem is that many organizations do not know that a customer is going to leave until well past the point of being able to intervene and prevent that customer from leaving. Churn prediction intelligence changes the equation by combining internal usage data with the external signals revealing what’s happening inside an account.
External Signals That Power Customer Churn Prediction Intelligence
Customers don’t churn in isolation. Their decisions are shaped by organizational, technological, and market forces often publicly visible if you know where to look.
Organizational change signals
Some of the strongest churn predictors have nothing to do with product satisfaction. Executive departures, especially the champion who bought your solution, eliminate internal advocacy. New leadership often brings preferred vendor relationships from previous roles. Layoffs or hiring freezes signal budget pressure forcing customers to cut spending. Mergers and acquisitions almost always lead to tool consolidation. When your competitor has a stronger footprint in the acquiring company, you face high risk. Department reorganizations disrupt your stakeholder base. A satisfied user without internal influence is still a churn risk.
Technology stack changes
Technographic movement provides another layer of early warning. Watch for adoption of competing or overlapping solutions. Removal of complementary tools you integrate with eliminates value drivers. Platform consolidation initiatives rationalize vendor stacks. Migration between ecosystems like AWS to Azure creates realignments affecting tool selection. When customers change their stack, vendor rationalization often follows. This is where external technology intelligence becomes critical for retention.
Business health indicators
Company-level health directly affects renewal behavior. Funding rounds signal expansion opportunities. Funding gaps or down rounds are signs of contraction risk and budget cuts. Revenue drops or public financial stress scenarios lead to cost, cutting initiatives where your contract becomes the subject of a detailed review. Loss of market share or intense competition results in changes of strategic priorities. Discontinuing the activities from specific geographies or segments limits your addressable market. If a customer is facing difficulties, they will abandon your product even if they like it.
Engagement decay patterns
Not all risks look like declining usage. Sometimes the most dangerous signal is silence. Reduced login frequency, lower feature exploration, drop in support interactions, declining survey participation, and champions becoming unresponsive all warrant attention. No support tickets can feel reassuring, but it often hides disengagement. Silence is often misread as stability. In reality, silence signals disengagement.
Building a Multi-Signal Churn Prediction Model
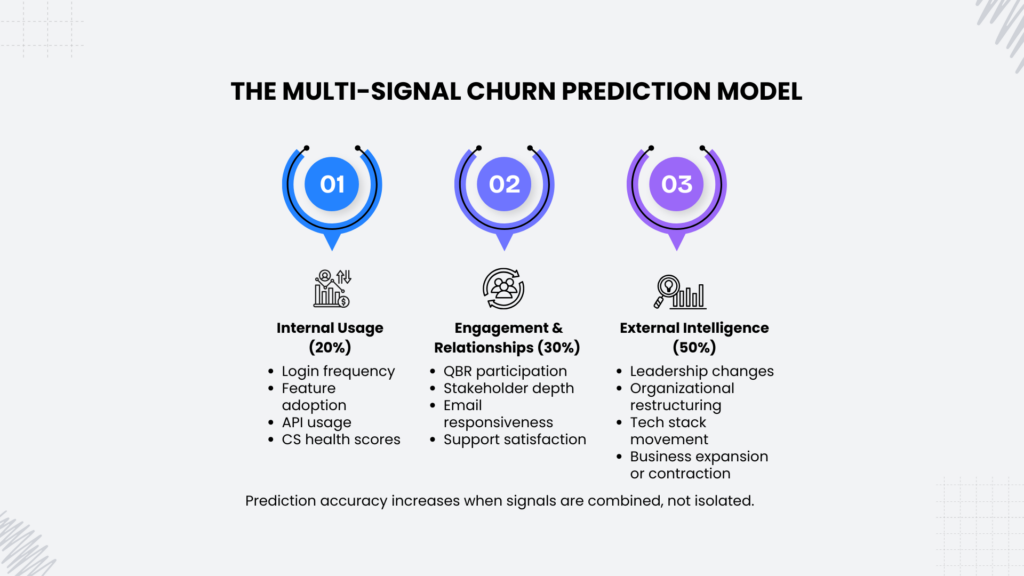
Effective customer churn prediction requires moving beyond single-source data. High-performing teams use multi-signal models blending internal and external intelligence. At Packed Data, churn risk is viewed as a composite of three distinct layers.
Layer 1:
Internal product usage contributes 20 percent of predictive power. This includes login frequency, feature adoption, API usage, and traditional CS health scores. It’s important, just not sufficient on its own.
Layer 2:
Engagement and relationship strength account for around 30% of what drives the prediction. This captures QBR attendance, email response rates, support satisfaction, and depth of relationships across stakeholders. Strong relationships offset temporary usage dips, but only if they exist beyond a single champion. Research from Gainsight shows companies running regular quarterly business reviews report 33 percent higher expansion revenue and lower silent churn likelihood.
Layer 3:
External firmographic and technographic signals deliver 50 percent of predictive power. This is where predictive accuracy accelerates. External signals include leadership changes, organizational restructuring, tech stack movement, and business expansion or contraction. This is where Packed Data Exchange adds differentiated value by continuously monitoring real-world company changes most CS tools never see.
Combined scoring framework
Signals are weighted and aggregated into a single churn risk score. Low risk accounts (0 to 30 percent) require relationship maintenance. Moderate risk (31 to 60 percent) signals strategic re-engagement need. High risk (61 to 100 percent) demands executive intervention and custom retention strategies. The goal isn’t precision to the decimal. The goal is early prioritization enabling timely intervention.
Proactive Retention: Turning Churn Prediction Intelligence Into Action
Prediction only matters if it drives action. Risk-based playbooks ensure appropriate intervention intensity matches churn probability.
High risk (61 to 100 percent): Executive intervention
These accounts require immediate, visible action. C-level outreach from your leadership demonstrates commitment and unlocks executive decision-making access. Your CEO reaching out to customer CEO signals account importance and often surfaces issues buried below executive visibility. Custom retention offers including pricing adjustments, expanded services, or feature acceleration address specific pain points. Dedicated technical or success resources provide intensive support. ROI re-validation and win-back case studies remind customers of value delivered. At this stage, silence guarantees churn.
Moderate risk (31 to 60 percent): Strategic re-engagement
This is the most valuable intervention window. Many churned customers are saved here with the right signal at the right time. Effective actions include insight-driven QBRs providing fresh value, not status updates. Feature training unlocks underused capabilities increasing stickiness. Introduction of new use cases expands footprint. The more stakeholders you engage, the stronger and safer the relationship becomes; so, you’re not dependent on a single point of contact. When original champion leaves, established relationships with peers and management ensure continuity.
Low risk (0 to 30 percent): Relationship maintenance
Low risk is not necessarily low return. Concentrate your efforts on consistent check-ins and updating the roadmap, exploiting upsell and cross-sell potential, turning customers into advocates through referral programs, and encouraging community and peer networking. If you are careful in your handling, thriving customers will become your growth engine.
Operationalizing Customer Churn Prediction Intelligence
Churn intelligence must live inside daily workflows, not dashboards no one checks. Technology infrastructure determines whether churn predictions drive action or sit ignored.
Real-time monitoring delivers automated alerts when accounts show external churn signals. When your customer’s executive champion updates LinkedIn profile indicating new role elsewhere, alert fires immediately. When customer adopts competing technology, CS team receives notification within days.
CRM enrichment surfaces churn risk scores directly on account records in Salesforce or HubSpot. Sales and CS teams access risk assessments without leaving their workflow. This transforms the CRM from a static database into a living intelligence system.
Trigger-based workflows automate task creation when risk thresholds cross. Account moving from low to moderate risk automatically creates QBR scheduling task for CSM. Account entering high risk alerts CS leadership and creates executive outreach task. When risk shows up, action follows automatically.
Leaders get a regular snapshot of churn risk that helps them stay ahead, focus their teams, and see the impact of early intervention. One SaaS organization using customer churn prediction intelligence reduced churn by 23%. They didn’t change the product. They changed when and how they engaged customers. Instead of scrambling at the last minute, they spotted risk months earlier and had time to actually strengthen the relationship.
The Future: Customer Churn Prediction Intelligence as Standard Practice
Customer churn does not happen randomly. It follows certain patterns. A lot of companies lose customers not because they don’t care, but simply because they notice the signs so late that they become helpless. When you unite product usage data, customer relationship metrics, and external demographics and technology information through a solution like Packed Data, churn turns into a matter of forecasting, managing, and stopping.
This is the transition from reacting to customers to predicting their retention. In the upcoming stage of B2B development, the successful ones won’t be those who acquire customers better. They’ll be the ones who understand their customers better, before they leave.