Tag Archives: Data Enrichment

Digital analytics dashboard visualizing performance metrics and insights related to B2B data cost efficiency and revenue optimization

The B2B Data Cost Efficiency Problem: Why Data Spend Does Not Correlate with Revenue Outcomes

B2B data cost efficiency has become one of the most overlooked levers in modern revenue operations. The average B2B company now spends $178,000 annually on data solutions and subscriptions; 34% more than three years ago, while pipeline velocity has dropped 8% and conversion rates have flatlined.

In a benchmark study conducted in 2025 among 150 data-driven B2B organizations, it was discovered that only 28% of firms which had a 42% rise in data expenditure were able to improve their revenues per sales rep. This is not an execution failure. It is a structural one.

The B2B data market has expanded into a fragmented ecosystem where the average company manages 15 or more separate data vendors. When 72% of sales teams pay for data features they never activate and 76% of RevOps organizations do not track revenue impact by data source, the problem is not a lack of information. It is a lack of efficiency.

The core issue: organizations optimize for data volume while ignoring data utility, activation rates, and alignment with actual go-to-market (GTM) execution.

Why Higher Data Spend Kills B2B Data Cost Efficiency

Each of these failure modes degrades B2B data cost efficiency in a distinct way.

The Three Recurring Failure Modes

Higher spend concentrates around three recurring failure modes, each compounding the others.

Redundant vendor purchases inflate costs without expanding coverage. Most revenue organizations run six to twelve data tools simultaneously: a primary database, enrichment API, technographic layer, intent platform, email verification service, and point solutions for specific verticals. These platforms frequently pull from the same upstream data brokers. A 2025 analysis of 40 sales-stack audits found that 73% of companies had at least two independent enrichment vendors, and 56% had two or more intent platforms. Yet only 31% could confidently identify which vendor drove materially better outcomes.

One middle-tier SaaS firm with Cognism, ZoomInfo, and Apollo running simultaneously saw that 47% of its target account contacts were common to all three platforms. The combined annual spend on these tools totaled $143,000. The unique coverage achieved because of this overlap: 8%. The additional spend amounted to $67,000 annually with zero pipeline value.

The Utilization and Alignment Gap

Low activation rates silently destroy ROI. The industry average for database utilization sits at 12% to 18%. Organizations purchase enterprise licenses based on projected coverage needs but activate only a fraction. A healthcare technology firm was able to quantify this in great detail – its $92,000 yearly investment in enrichments equated to 840,000 API calls. Post-enrichment analysis revealed that 340,000 API calls were enriching contacts who were scoring below the client’s minimum ICP threshold, and 190,000 calls were enriching contacts tagged “do not contact” or in dormant segments for 18 months. Utilization: 37%

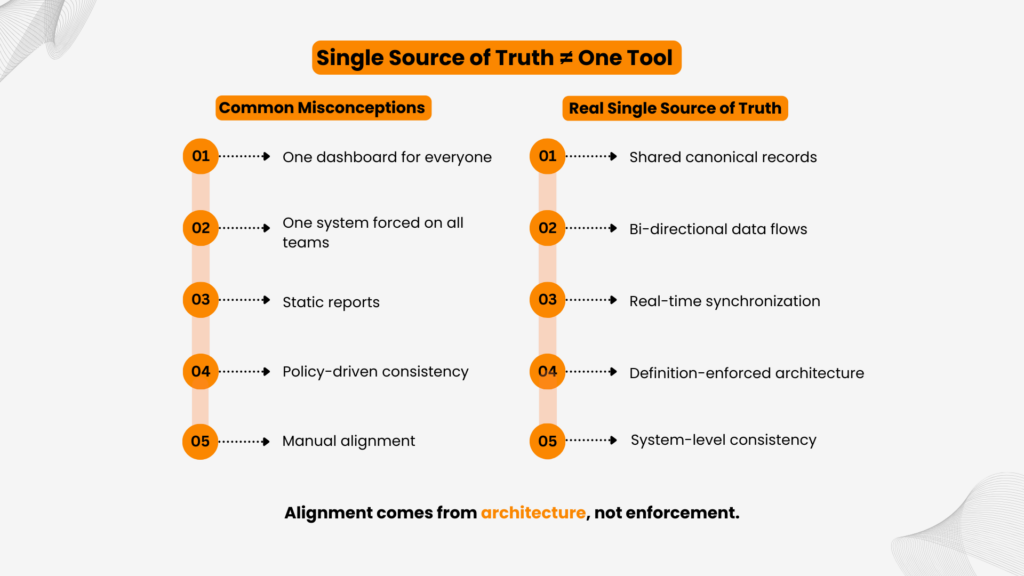
GTM misalignment converts quality data into expensive noise. Data purchases often proceed independently of strategy changes. Sales teams buy databases optimized for outbound at scale while the company pivots to account-based strategies. Marketing acquires intent signals for accounts that SDRs are not assigned to. When data outputs live in dashboards instead of playbooks, routing rules, or performance targets, spending on data without changing behavior changes nothing.

Volume vs. Accuracy: The Data Efficiency Trade-Off That Shapes Pipeline ROI

The instinct to purchase larger databases is understandable but consistently counterproductive. Volume creates an illusion of capability while masking the cost of poor quality.

Consider two scenarios. A company with 80,000 CRM records spending $90,000 annually on data, with a typical usability rate of 35%, pays $3.21 per usable record. A smaller database of 40,000 records with 55% usability costs just $2.50 per usable record. Volume is not value. It is a larger surface area for the same underlying problems.

This trade-off intensifies with intent signals. Intent data is one of the biggest drivers of modern data spend and one of the least efficiently used. Organizations ingest thousands of unstructured third-party signals weekly without internal filters. An enterprise software firm might receive an alert that a target account is searching for “cloud security,” but if the provider cannot identify which business unit is executing that search, sales teams cold-call generic contacts. The result is low conversion, wasted capacity, and data spend that drives activity without driving revenue. You can read more here.

High-accuracy, lower-volume datasets consistently outperform high-volume generalized databases in pipeline contribution. One financial services company spent $67,000 on an 18,000-contact healthcare vertical database. Six months later, it generated $180,000 in pipeline from 11 accounts, all of which were already known and engaged. Meanwhile, their underfunded enterprise motion produced $4.2M in pipeline from a $12,000 investment in executive intent data targeted at existing customers in expansion phases. Precision won by a factor of 35 on pipeline ROI.

The Data Activation Matrix: Measuring B2B Data ROI Across Every Vendor

Most organizations lack formal efficiency metrics for data investments. That gap prevents optimization. Three metrics, tracked together, that form the foundation of any B2B data cost efficiency framework and expose where value erodes.

Cost Per Usable Record (CPUR) reveals the true price of quality. The formula accounts for total investment against records that actually meet accuracy and delivery standards:

CPUR = (Tool Cost + Labor Cost + Decay Cost) / (Number of Records * Usability Ratio)

An organization investing an extra $14,000 in tools for improving data quality but lowering the cost associated with labor by $10,000, as well as boosting usability from 55% to 78%, will lower its cost per record usage from $2.50 to $1.89. This is compounding data infrastructure.

Cost Per Activated Account (CPAA) measures GTM alignment. For an account to count as activated, it must enter a meaningful sales motion, not just exist in a list or scoring dashboard. This metric exposes inefficiencies where data is purchased at scale but activation rates remain low, or where one vendor shapes actual plays while another is ignored despite similar contract value.

Pipeline Impact Per Dollar of Data Spend is the most strategic metric and the hardest to calculate. It requires tagging pipeline by data source and comparing performance against a baseline. Organizations that attempt this consistently find that a minority of vendors drive the majority of incremental pipeline, and that some high-cost “table-stakes” products produce no measurable lift when removed.

A useful triage framework maps vendors across two dimensions: value (pipeline generated per dollar) and efficiency (CPUR or CPAA). Vendors that are low-value and low-efficiency are candidates for elimination. High-value but low-efficiency vendors merit closer scrutiny and usage optimization. High-value, high-efficiency vendors deserve consolidation of spend and negotiating leverage.

Four Shifts That Recover 25-40% of Wasted Data Spend

Organizations that improve B2B data cost efficiency follow a consistent approach.

Focus on a core-with-specialties approach. Replace the patchwork of multi-vendor systems with a layered approach consisting of one general vendor that provides coverage overall, plus one or two specialty vendors with differentiating capabilities such as deep verticals, international reach, or intent signals. By focusing on two vendors as opposed to seven, a logistics software company was able to lower its costs from $156,000 to $89,000 while improving contact uniqueness coverage by 12%.

Route inbound leads through a low-cost validation layer first: check for valid email format, filter personal domains, remove duplicates. Only verified enterprise leads proceed to premium API enrichment. This ensures high-cost API credits are spent on viable, sales-ready opportunities rather than junk sign-ups or personal email addresses.

Build performance-based vendor evaluation into renewal cycles. Measure accuracy rate, data freshness, and pipeline correlation for every vendor, updated quarterly. Vendors scoring below a defined threshold enter performance review. Vendors that cannot demonstrate measurable pipeline contribution should not receive automatic renewals. This approach prevents incumbent inertia, the tendency to renew underperforming vendors due to switching friction.

Embed data into GTM workflows rather than adjacent to them. Scoring, routing, sequencing, and playbooks must be driven by data, not informed by it after the fact. A 2025 case study found that a 25% increase in the fraction of SDR time spent on data-driven accounts led to a 19% increase in pipeline per salesperson with no change to the underlying data budget. The efficiency gain came from usage, not volume.

Data Cost Efficiency Is the GTM Competitive Advantage

The modern GTM environment is not short on data. It is short on economically effective intelligence systems.

Organizations that keep increasing their number of records, suppliers, and data signals without getting better at activating and making decisions based on data will experience increasing expenses and inconsistent commercial results. Organizations focused on B2B data cost efficiency; not just data volume, consistently recover 25-40% of wasted spend.

The recovered capital, often $50,000 to $150,000 annually, funds higher-impact revenue initiatives with measurable ROI.

Data cost efficiency is not a procurement metric. It is a revenue strategy. The question is not whether your data budget is large enough. It is whether your data investment is actually changing decisions, improving execution, and driving pipeline that closes.

Business professionals reviewing analytics reports and charts to assess B2B data lifecycle management and identify where data loses value over time

The Data Lifecycle Breakdown: Where Data Loses Value Across Its Journey

There are 100,000 customers in your CRM. Your marketing automation system measures millions of actions. Your data warehouse holds years of transaction history. Yet effective B2B data lifecycle management remains elusive: salespeople cannot identify decision makers, marketing campaigns miss targets, and forecast numbers fall short. The problem isn’t data quantity, it’s how data degrades across the B2B data lifecycle stages from collection to activation.

Research shows that poor data quality costs B2B organizations an average of $12.9 million annually, with 73% of enterprise data losing 47% of its value as it moves from collection to activation. For RevOps leaders, this represents a systematic revenue drain that compounds at every stage.

The Six-Stage B2B Data Lifecycle Management Framework

Effective B2B data lifecycle management requires understanding that data doesn’t lose value at a single point. It degrades continuously across six distinct stages, each presenting opportunities for value preservation or deterioration.

Collection

Collection establishes the foundation. Whether data enters through form fills, API integrations, or third-party providers, initial capture determines maximum potential value. Industry analysis reveals that 68% of collected data lacks contextual relevance despite 94% technical accuracy. A form capturing job title without role function or buying stage limits downstream utility regardless of processing quality.

Processing

Processing transforms raw inputs into structured formats through deduplication, normalization, validation, and field mapping. Validity’s 2024 report found that 25% of B2B contact records contain critical errors introduced during processing, not at collection. When transformation rules fail to handle input variety, “IBM,” “International Business Machines,” and “IBM Corp” create separate account records, fragmenting engagement history and account intelligence.

Storage

Storage preserves data integrity and accessibility. Architecture determines whether historical context remains available when needed. Research indicates that 60% of Tier 1 data remains untouched for over 90 days, consuming expensive storage for dormant records. The critical failure is context loss. When storage systems don’t preserve enrichment timestamps, teams can’t distinguish stale intent signals from current buying behavior.

Enrichment

Enrichment adds external context that enhances decision-making. Forrester research shows that organizations using intent data see 20% higher conversion rates, but only when signals remain recent (under 14 days) and contextually relevant. Generic intent scoring that flags “technology interest” isn’t actionable. Specific signals like “evaluating Salesforce competitors” enable precise outreach. The coverage versus accuracy dilemma persists: one B2B company reduced enrichment costs by 40% by eliminating 11 low-usage fields and reinvesting in higher-quality technographic data sales actually referenced.

Activation

Activation converts stored data into action through lead routing, email sequences, opportunity scoring, and account identification. Data value follows an exponential decay curve once activation conditions are met. InsideSales research shows response rates are highest within 4 hours of a trigger event, drop 35% after 24 hours, and fall below baseline after 72 hours. Yet most systems operate on batch processing, creating systematic activation delays that erode value even when upstream processes work perfectly.

Maintaining

Maintaining sustains the value of your data by doing things like updates and deletions. Your B2B database tends to depreciate at a rate of 22.5-30% per year due to changes in jobs and mergers of companies. Failure to maintain your list results in bounced emails and ineffective campaigns.

Where Data Lifecycle Breakdowns Destroy Pipeline Value

Value erosion compounds across stage transitions. A pipeline intelligence analysis showed accounts collected with 94% hygiene processed into 91% accurate enrichment and stored for 89% query coverage, but activation delivered only 47% ICP-relevant signals to SDRs. By maintenance, intent scores decayed 28% quarterly, costing $4.1 million in pursuing invalid opportunities.

The collection breakdown

The collection breakdown occurs when organizations optimize for volume over signal quality. A SaaS company might capture 10,000 inbound leads monthly with 95% email deliverability yet see only 8% MQL conversion because forms don’t capture buying stage, budget authority, or implementation timeline. Salesforce research found that 70% of B2B buyers fully define requirements before engaging vendors. Collection systems that don’t identify where prospects are in this journey create misalignment between sales readiness and outreach timing.

The processing breakdown

The processing breakdown fragments intelligence across systems. One enterprise software company discovered that processing errors created 18% duplicate account records, causing sales teams to unknowingly multi-thread 1 in 5 target accounts with conflicting messaging. When “Head of Marketing” maps differently across systems, segmentation outputs conflict and prioritization becomes unreliable.
You can read more here.

The storage breakdown

The storage breakdown trades query speed for historical context. When contact records show current job titles but not previous roles, sales teams can’t identify job changes, a buying trigger that increases close rates by 30% according to LinkedIn data. A healthcare company implementing proper tiered storage moved 95% of patient records to lower-cost tiers, reducing monthly storage costs by 52% while maintaining compliance.

The enrichment breakdown

The enrichment breakdown layers on data without evaluating utility. Coverage metrics advertise database size, but a contact database with 90% email deliverability and only 40% accuracy on buying committee roles fails enterprise sales requirements. Enrichment vendors updating only 70% of records create uneven data quality that introduces bias into segmentation and scoring models.

The activation breakdown

The activation breakdown creates timing value decay. A mid-size company tracked that leads waited 18 hours for enrichment processing, 6 hours for scoring rules to run, and 4 more hours for routing logic to execute. This 28-hour delay destroyed conversion potential. When a prospect downloads a competitive comparison guide, every hour of delay reduces response rates and pipeline probability.

The maintenance breakdown

The maintenance breakdown allows quality to degrade invisibly. One company audited infrastructure and found 14 terabytes of duplicate customer records, outdated lead files, and orphaned CSV exports. Their annual storage bill exceeded $47,000 for data nobody accessed. Without validation processes and monitoring, organizations operate blind to accumulating waste.

The Data Lifecycle Value Preservation Framework

High-performing B2B data lifecycle management teams optimize value flow across transitions rather than stages in isolation. This requires measuring value retention at each handoff point.

Metrics at stage level set baselines for performance: collection signal-to-noise ratio (portion of fields used in qualification), processing deduplication efficiency, storage query latency at P95, field usage rate in enrichments, median time to route for activations, and refresh schedule versus recommended intervals.

Cross-stage value measurement links decisions made at earlier stages to their outcomes.When collection forms change, measure not just completion rates but 30-day conversion impact. When enrichment vendors change, track sales qualification efficiency. This creates feedback loops optimizing for business outcomes rather than isolated KPIs.

Bottleneck identification reveals where data spends time without value addition. If the median lead waits 14 hours in enrichment queues but only 2 hours in scoring, enrichment is the constraint. If 60% of leads fail activation due to missing phone numbers but collection forms don’t require them, collection is the bottleneck.

Threshold-based activation preserves value by eliminating unnecessary processing steps. Instead of enriching all leads to 100% completeness before routing, route immediately on three intent signals and enrich asynchronously. An enterprise software organization was able to drop time to first sales touch from 31 hours to 4.5 hours.

Practical Recommendations for RevOps Leaders

Audit your complete process lifecycle. Map each stage and measure value drop per transition. Industry data suggests siloed systems achieve 47% end-to-end value preservation compared to 91% for integrated lifecycle approaches. The gap represents recoverable pipeline opportunity.

Define stage-level SLAs. Collection relevance above 94%, processing yield above 91%, storage freshness under 7 days, enrichment precision above 87%, activation utilization above 94%, and maintenance decay below 3% monthly. Lifecycle value equals the minimum stage SLA because the weakest link governs revenue impact.

Implement tiered storage. Move data not accessed in 90 days out of expensive Tier 1 storage. Automated policies for archiving reduce costs while maintaining accessibility for legitimate future use.

Prioritize activation velocity over enrichment completeness. Data value isn’t determined by quality at rest but utility in motion. An 80% complete record activating within 4 hours of a trigger event drives more pipeline than a perfectly accurate record reaching sales three weeks after showing buying intent.

Build continuous validation into workflows. When an SDR flags a bad number, that signal should flow back to maintenance and collection stages instantly. The automated system detects the depletion in enrichment levels at 18%, day 7 as against day 47.

Master Data Lifecycle Management for Revenue Impact

The degradation rate of data due to natural decay is 30% per year. But lifecycle breakdowns accelerate erosion to 53%, destroying $4.1 million in pipeline effectiveness for a typical mid-market organization.

RevOps leaders who master data lifecycle management in B2B understand that not all data needs perfection before activation, that coverage matters less than relevance, and that speed often creates more value than completeness. The organizations that win don’t hoard the most data. They manage the journey with intentionality at every stage, preserving actionable intelligence from collection through activation.

Because in 2026, perfect activation on decayed data wastes cycles. Lifecycle intelligence compounds pipeline value continuously.

Business professional analyzing multiple dashboards and analytics screens to transform raw information into actionable data context for GTM intelligence

Data Context: Transform Raw Data Into GTM Intelligence

You have 50,000 contacts in your CRM. You process millions of behavioral events in your data warehouse. There are 247 active leads on your dashboard. But your salespeople still can’t tell when customers are ready to purchase. Your marketing campaigns seem generic. And your forecasts are still a shot in the dark.

The problem isn’t data volume, it’s data context. Without context, even accurate data produces no results.

Industry statistics show that up to 80% of all enterprise data is never leveraged because it lacks any kind of context. People just aren’t able to apply this data into meaningful action. That’s the problem with data context, data that is accurate yet unable to produce results simply because it’s not contextualized within the business process and decision-making.

GTM is one area where this challenge makes an immediate impact.

What Data Context Means for GTM Teams

Data context consists of three interconnected layers that transform raw information into intelligence: Why is this data important? To whom does the data apply? And how should this impact on their decision-making process?

The business relevance layer connects the data to your unique GTM strategy. The significance of someone holding the director’s title varies in different organizations. A fundraise event will only have implications for expansion only if your product helps enterprises scale. Without such context, firmographic details such as industry and company size lack precision for segmenting customers.

The role context layer defines where a person fits in the buying decision process. Is the individual an influencer, decision-maker, or end-user? What is the significance of the same title in small firms versus large corporations? A VP of marketing role holds entirely different responsibilities when compared between a Series A startup and Fortune 500 company.

Usage context determines when and how data should trigger action. A product usage spike indicates expansion readiness only if it follows adoption of key features. A job change matters only if the new role has budget authority. Intent signals without buying stage context lead to misguided outreach.

As one analysis explains, without semantic definitions mapping business terms to precise data, teams improvise. They see a customers table and assume every row is a customer. These assumptions are wrong often enough to make systems unreliable.

Where Data Context Breaks Down in RevOps

The data context gap appears in four predictable areas across revenue operations.

Generic datasets provide standardized fields and broad coverage but not business-specific relevance. A typical B2B database delivers company size, industry, and job titles without growth stage, technology stack, or buying intent. According to analysis of intent data evolution, first-wave intent failed precisely because it lacked persona-level precision needed to identify actual buying group members. Sales received lists of hot accounts with no context on who to call or what their role-specific pain points were.

Lack of segmentation means treating all contacts within a title cohort as identical. Marketing targets all Marketing Managers without filtering by industry, company size, or intent. The result is diluted messaging and lower engagement.

Absence of linking prevents understanding relationships between data points. A funding announcement without hiring data does not indicate expansion capacity. A job change without company growth context does not signal authority. In most cases, there is intent data on one platform, technographic data in another, and the CRM history on yet another. In this case, because there is no connection between all these points, you may be seeing someone visiting the pricing page when they have just created a support ticket.

Over-reliance on raw fields leads teams to depend on individual attributes instead of derived insights. Using job title alone misses the value of combining role, influence level, and buying stage into a composite signal.

How Missing Data Context Impacts GTM Performance

Missing context cascades through every revenue function.

Poor targeting results from treating all accounts within firmographic bands as equal. Without growth stage, technology fit, and intent context, marketing campaigns reach companies that cannot buy. Sales teams prioritize accounts that will not convert. Campaigns targeting all Marketing Managers without context include low-fit segments, producing diluted messaging and lower conversion rates.

Weak prioritization means all leads receive equal treatment. High-value accounts get ignored while low-potential prospects consume resources. Without scoring based on intent plus fit, pipeline quality suffers. One analysis notes that without access to complete context, execution breaks down. A hyper-growth customer showing early churn signals needs proactive outreach before they start evaluating alternatives. None of these plays work effectively without deep, unified context about the account.

Ineffective decision-making follows from incomplete intelligence. A lead score based solely on engagement volume misses whether the engaged contact is a decision-maker. A territory plan based solely on company count misses growth trajectory. Leaders might allocate more budget to the region with the most leads, not realizing another region has leads with much higher contextual fit.

Operational inefficiency emerges when large datasets are processed without context. Low signal quality means wasted effort and increased customer acquisition costs. Scaling raw data without context leads to more noise, not more insight.

A Framework for Building Data Context in Your Stack

Building effective data context requires a four-layer approach:

Layer 1: Raw Data includes contacts, accounts, activities, and signals. It has high volume but low inherent meaning.

Layer 2: Enrichment adds firmographics, technographics, and intent signals to increase data depth. According to 6sense analysis, data enrichment solves the context problem by filling gaps and adding context that turns skeletal records into complete, actionable profiles.

Layer 3: Context transforms data into ICP alignment, account tiers, buying stage, and role relevance through scoring models, segmentation frameworks, and relationship mapping. This is where most teams stop at enrichment but high performers invest in true context because enrichment adds data while context adds meaning.

Layer 4: Decision connects data to actions, workflows, and campaigns through lead routing, outreach triggers, and prioritization queues.

According to the evolution of intent data, the fundamental shift is how data is used. Intent data is now the engine of signal-based revenue operations. When a high-value signal is detected, modern systems can trigger a nurture sequence, send an instant notification to the BDR, and populate an ad audience.

Making Data Actionable in GTM Systems

Adding context is necessary but insufficient. Context must be integrated into workflows to drive action.

Align with business goals before adding context. Every dataset should answer how this impacts pipeline. As one Chief Data Officer learned, data initiatives fail when they exist in isolation. The approach changed when they stopped treating data as a separate function and started embedding it directly into business strategy.

Integrate into workflows so context triggers action. Ensure data feeds into CRM actions, campaign triggers, and sales prioritization. Context viewed in reports is unused. Context embedded in CRM records, alert workflows, and campaign segmentation drives action.

Facilitate interpretation on a large scale with semantic layers to determine meaning. Avoid unnecessary analysis by offering explicit signals and pre-classified data types. Ensure consistency with standardized logic for all applications, including artificial intelligence, business intelligence, and analytics.
You can read more, here.

Strike a balance between coverage and relevance. Data quantity does not guarantee quality decision-making. Prioritize meaningful data over sheer numbers.

Data Context Implementation: RevOps Best Practices

Audit data usage. Identify which data fields actually influence decisions. Most organizations discover they are enriching for volume rather than decision-critical attributes.

Define context models explicitly. Create clear frameworks for ICP, segmentation, and prioritization. Build a semantic layer that defines what key terms mean for your business. Active lead, qualified account, and expansion opportunity must have precise, shared definitions.

Layer intent on top of fit. Firmographic fit tells you who could buy. Intent context tells you who is ready to buy now. Without both, prioritization remains guesswork.

Reduce raw data dependency. Shift from field-level analysis to derived insights. Create scores, categories, and segments instead of depending on individual attributes.

Standardize context across teams. Ensure consistent definitions and unified usage. When different teams operate from different contexts, marketing builds campaigns around generic personas while sales discovers actual decision-makers in conversations.

Measure context effectiveness. Track conversion improvements, targeting accuracy, and pipeline quality to validate that context is driving business outcomes.

Conclusion: Data Context Transforms Raw Data Into Revenue

Raw data is potential. Context is activation.

The organizations that scale successfully are not those with the most data but those that add the most relevant context, transforming fragments into insights, records into relationships, and signals into pipeline.

In modern GTM systems, data collection is easy and enrichment is scalable. But context remains the differentiator. Organizations that solve the data context problem move from noise to signal, from activity to efficiency, from data to revenue.

The question is not whether you have enough data. The question is whether you understand what it means. Because without context, you do not have intelligence. You have noise.

Business professionals analyzing reports highlighting data blind spots in performance and decision making

The Cost of Data Blind Spots: What You Don’t See

Your VP of Sales reviews the monthly dashboard. Pipeline looks healthy. Activity metrics hit targets. Three months later, deals you counted on evaporate. Top accounts churn without warning. The quarter ends 23% below projection, yet every dashboard showed green. This is the expensive reality of data blind spots.

Research shows 42% of companies experience revenue leakage to some degree, with poor data quality costing businesses an average of $12.9 million annually. According to Gartner’s Research, organizations report that poor data quality undermines 40% of business initiatives, with financial impacts ranging from $9.7M to $14.2M annually depending on company size. Companies typically lose 5% to 15% of potential revenue due to pipeline leaks caused by unreachable prospects and invisible market changes. In the U.S. alone, poor data quality costs businesses an estimated $3.1 trillion annually.

The problem is not what you measure. The problem is what exists outside your measurements: external company changes you never detect, shadow buying committee members your CRM never captured, and parent-subsidiary relationships influencing decisions you cannot see.

The Illusion of Data Coverage

“We have dashboards for everything” represents one of the most dangerous assumptions in modern B2B organizations. Your internal systems tell you what happened within your walls: emails sent, calls logged, opportunities created. They are silent about the changes happening outside, changes that fundamentally alter your customers’ needs and your prospects’ readiness.

B2B contact data decays at 22.5-30% per year. If you are not actively refreshing, nearly a third of your supposed visibility vanishes every twelve months. Coverage and visibility are fundamentally different. Coverage means you measure many things. Visibility means you see what actually matters.

Five Data Blind Spots Quietly Draining Revenue

These five data blind spots drain revenue silently, creating invisible losses that traditional dashboards never reveal.

External Company Changes

Companies frequently merge, restructure, or pivot without a clear signal in your CRM. B2B data expires at a rate of 2.1% per month, which adds to 70% per year in high employee turnover industries. If a representative who was supporting a deal leaves the company, the deal will be quietly delayed without your team knowing for several months. Usually, sales personnel come to know about these changes, after weeks or even months, when deals become stagnant due to some factors which can be known through external intelligence from the very beginning.

Shadow Buying Groups

Your CRM lists three stakeholders. Reality involves far more. Research shows buying committees average 13 members in 2025, with the majority remaining invisible to your sales team. Your champion advocates internally but gets overruled by executives you never engaged. Technical evaluators who might be unknown to you cancel your solution because of some criteria that your team never thought of. If you don’t have buyer intent signals, you are only having a conversation with the person who claims to be the decision-maker, but not with the people who have the power to veto.

Parent-Subsidiary Influence Gaps

Your team pursues a subsidiary as an independent opportunity, unaware that parent company policies mandate specific vendors or procurement processes. You close a small subsidiary deal without recognizing the expansion potential across the enterprise parent. Research estimates 35% of B2B revenue is linked to subsidiary relationships. These dynamics unfold invisibly until deals die or renewals fail for reasons that seem to appear from nowhere.

Technology Changes Outside Your Stack

A prospect deploys new infrastructure that makes your solution incompatible. A customer migrates to platforms your product cannot support. If a prospect quietly drops a competitor’s tool or integrates a new platform that makes your solution a perfect fit, and you do not see that signal, you have missed the ideal engagement window. Packed Data surfaces exactly these technographic shifts, giving your team visibility into technology adoption before it affects deal outcomes.

Market Exits and Contractions

Companies announce that they are closing offices, cutting capital spending, or becoming financially distressed. Such events have huge implications for the revenue of the vendors who serve these companies. However, these signals are generally found in news and regulatory filings, which are quite isolated from your CRM. When your sales team gets notified by declining engagement metrics, it is usually too late – the opportunity has already been closed.

How Data Blind Spots Translate to Revenue Loss

Each blind spot creates a specific and measurable category of revenue damage.

Missed Upsell Windows: Customer environments evolve, creating natural expansion opportunities. Organizations with visibility engage during ideal buying windows. Those operating blind miss them entirely or discover them too late when budgets have already been allocated elsewhere. Research confirms companies lose $500,000 to $1.5 million in revenue simply from not reaching the right contacts at the right time.

Late Churn Detection: By the time internal usage data shows a customer disengaging, they have typically completed extensive alternative evaluation. External signals reveal churn risk far earlier: a departing champion, a funding crunch, a technology replacement. These signals predict churn months before any internal metric reflects them. Packed Data’s real-time company insights are built to surface these early warnings before it is too late to act.

Wasted Sales Cycles: Sales reps waste 27% of their possible selling time due to inaccurate data alone, which stands for 62 working days lost annually per sales rep. For example, a prospect did not have enough budget whereas your sales team got to know it only at the final stages. The decision-making power is with the parent company procurement team, but nobody has caught on to the relationship.

Misallocated Territories: Territory planning built on incomplete data sends reps after accounts that do not match ideal customer profiles while perfect-fit prospects sit ignored. Organizations persistently underperform in markets where they should win, simply because blind spots prevent effective targeting.

Finding Your Data Blind Spots: A Diagnostic Framework

Data Completeness Audits

Don’t stop at checking if a field is completed, instead check if it is accurate. One way to verify a database is to compare it with a CRM. For instance, a CRM showing a company with 500 employees while their firmographic data indicates they have grown to 2,000; this discrepancy will lead to a change in your forecast.

Packed Data advocates this as the first diagnostic step: sample 50 top opportunities and assess how many lack complete stakeholder visibility, hierarchy data, or current technology context.

Signal Gap Analysis and Internal vs. External Comparisons

Look at your last ten closed-lost deals. How many failed because of a factor that was knowable but not known? Map the signals that predict customer behavior against the data you currently capture. Do you track executive changes, funding events, technology adoptions, and market contractions? Organizations integrating external buying signals with internal engagement data improve lead qualification accuracy by 30% to 40%. Run a sample of accounts through an external intelligence source. Organizations conducting these comparisons typically discover that 40% to 70% of internal data contains material inaccuracies relative to external reality.

Closing Data Blind Spots: From Visibility Gaps to Intelligence

Closing data blind spots requires external intelligence layers and continuous enrichment strategies.

External Intelligence Layers and Continuous Enrichment

Firmographic data keeps company attributes current. Technographic data reveals technological stack changes. Intent data signals active research. Hierarchy data maps parent-subsidiary relationships. Packed Data combines these layers into a continuous account intelligence feed, turning external blind spots into internal visibility.

Batch updates are no longer sufficient. Changes in reality dictate when data needs to be updated, not when the quarter ends. AI-powered monitoring detects changes in the company, fundraising activities, and leadership changes as they occur and automatically sends updates to your CRM.

Proactive Monitoring Over Reactive Analysis

When a high-value account hires a new CTO, your sales team should know that day. When a customer adopts a competitor’s tool, customer success should receive an alert immediately. Move from asking “What happened?” to acting on “What is happening right now?” This shift requires both technology and process change. Technology provides the external intelligence infrastructure. Process ensures teams use it in daily workflows rather than reverting to decisions built on incomplete internal data.

Visibility Determines Revenue Outcomes

Revenue performance depends on the information you have at the time of making decisions. Conduct a thorough check of your data environment. Ask: What aspects of my customers do I not know? What changes have I missed? What signals are still silent?

Create a practical 90-day roadmap in the first month, review the datasets and evaluate them for completeness. In the second, integrate external intelligence layers and set up change alerts. In the third, automate enrichment pipelines with defined data freshness standards. Organizations that have closed their blind spots report revenue leakage dropping by 45% and ARR gains exceeding $4 million.

Organizations that systematically eliminate data blind spots outperform competitors who rely solely on internal metrics. The organizations that see more of the market make better decisions within it.

Glowing blue network map showing interconnected data points and cloud storage, illustrating a modern, scalable RevOps data infrastructure.

RevOps Data Infrastructure: Building the Single Source of Truth

While your sales VP reports $2.3 million in pipeline, your marketing director presents $2.8 million and your finance team forecasts only $1.9 million. Three different versions of the truth. Three teams pointing fingers. Zero confidence in any number. This is what happens without proper RevOps data infrastructure.

Your business is losing millions as a result of this RevOps data crisis. Recent Salesforce research indicate that sales representatives only spend 28% of their time selling. Finding accurate contact details, resolving inconsistent account records, and manually updating systems where automation should exist take up the remaining time. According to research, data fragmentation costs businesses between 15 and 20 percent of their potential revenue. This amounts to an annual loss of $7.5 to $10 million for a $50 million firm. Building proper RevOps data infrastructure eliminates this waste.

When every team maintains different numbers, trust erodes. Executives question every forecast. Sales reps ignore CRM data. Marketing campaigns target outdated contacts. Customer success teams lack visibility into early warning signs.

Single Source of Truth: RevOps Data Infrastructure Foundation

Single source of truth doesn’t mean forcing everyone onto one tool or making all teams use identical dashboards. Those approaches fail because they ignore how different functions need different views of the same underlying data.

Real single source of truth means ensuring data flows bidirectionally between systems automatically. When a sales rep updates an opportunity in Salesforce, marketing automation platforms reflect that change instantly; meanwhile, when marketing scores a lead based on engagement, sales sees updated prioritization in real-time, and when customer success logs a support ticket, account health scores adjust across all systems.

This requires maintaining consistent definitions across teams. What qualifies as a Marketing Qualified Lead? When does an opportunity enter “Negotiation” stage? What constitutes an active account versus dormant? Organizations with unified data strategies establish these definitions early and enforce them through technical architecture, not policy documents gathering dust.

The foundation is having one canonical record for each account and contact accessible everywhere. Account hierarchy matters. Parent-subsidiary relationships. Territory assignments. These key data elements need to be based on a single source of truth, with all other systems reading from these sources instead of duplicating each other with multiple versions.

Most RevOps data infrastructure uses a hub-and-spoke model. Your CRM acts as the hub. Data enrichment platforms, marketing automation tools, sales engagement tools, and analytics systems are the spokes. Data flows into the hub from all sources. The hub cleanses it. Standardizes it. Returns it to operational systems.

The Five Data Types RevOps Must Unify

All of the metrics mentioned below can be measured independently, through multiple technologies (marketing automation platforms; website analytics systems; sales engagement software) and they all indicate a different kind of engagement type. Unified engagement scoring combines these signals into comprehensive account-level metrics showing overall interest and activity patterns over time.

Customer and Account Data

Customer and account data forms the foundation. Firmographics (e.g. account size), technographics (e.g. individual software applications), and the overall account history will provide your team with context when interacting with accounts. Key fields in an account include firmographics, such as parent-child accounts; technographics based on rep ownership at individual accounts geographically and/or demographically; and historical engagement information that will help with future conversations at the account. Enrichment platforms continuously append missing firmographic and technographic data, ensuring profiles remain complete as accounts evolve.

Contact and People Data

Contact and people data identifies who influences decisions. The individuals in the buying committee as well as those who will influence or decide upon a purchase will determine how you go about reaching out to you. The role of each individual, at what level, who they work for, and how accurate their contact details are can help you to effectively target all potential contacts. Systems must be in place to track these contacts, since 30% of B2B contacts change roles every year. When a champion moves companies, sales needs immediate notification to maintain relationships and potentially follow them to new opportunities.

Engagement Statistics

Engagement statistics determine the level of engagement between accounts and your brand. The following are just a few examples of metrics that you can use to track how much interest an account has shown in your business or brand: email open/clicks; website visits; content downloads; number of meetings attended; requests for demos.

Intent Data

Intent data reveals research signals and buying stage indicators. Third-party intent providers track when accounts research solutions in your category across B2B publications and review sites. First-party behavior tracking captures on-site signals. Surge timing matters. When multiple decision-makers from an account suddenly increase research activity, timing and relevance improve.

Revenue Data

Revenue data drives forecasting and planning. Opportunities, pipeline stages, close dates, deal values, and forecasts must reconcile across sales, finance, and executive dashboards. CRM systems, configure-price-quote tools, and finance platforms each maintain revenue records. Inconsistencies here create the “three versions of truth” problem. Stage definitions, probability assignments, and forecast categories need standardization enforced through workflow automation.

Building Your RevOps Data Infrastructure Hub

Leading organizations adopt centralized data enrichment approaches rather than point-to-point integrations that create unmaintainable complexity. A central hub receives data from all sources, enriches and standardizes information, then distributes clean data back to operational systems.

Account intelligence platforms serve this role by providing single points for firmographic and technographic append. When fresh records are added into your CRM, the enrichment APIs will cover any deficiencies, including the following fields: employee count, annual revenue, industry classification, technology stack, and funding stage.

Companies such as Packed Data Services provide the essential central enrichment functions by adding info about firmographics, technographics and aggregating intent signals from various sources and assigning a unified score to each account. They combine account intelligence, intent signals and AI-driven lead prioritization to provide customers with a complete view of their accounts in real-time and in tandem with each other between sales and marketing tools, thereby minimizing the integration difficulties that have traditionally created a point-to-point linking model.

Actionable Intelligence and Real-Time Scaling

Intent signal aggregation centralizes scoring across multiple intent sources. Third-party providers each track different publication networks and research behaviors. Centralized platforms normalize these signals into unified intent scores showing which accounts are actively researching solutions. Combined with fit and engagement data, account scoring engines produce single prioritization scores guiding both sales and marketing efforts.

Real-time alerting notifies teams when accounts hit threshold scores or show buying signals. When an enterprise account’s intent score surges, engagement increases, and technographic signals indicate budget approval, automated workflows alert assigned sales reps and trigger personalized outreach sequences.

With an API-first architecture you can connect any tool within your architecture, including pre-built connectors such as those used for Salesforce, HubSpot, Marketo, Outreach, etc., which will speed up your implementation process; however, if you have any custom systems or tools that are specific to your workflow, there are APIs available that integrate those tools into your API stack.

The 90-Day RevOps Data Infrastructure Roadmap

Days 1-30

Focus on audit and definition. Map all current data sources and flows. Records that refer to accounts, contacts, opportunities, and engagement data are kept in various systems. A thorough study of the data flow between systems at the present time and the identification of manual operations that cause bottlenecks in the workflow should be done. Definitions of fields should be recorded and a data dictionary should be compiled. The question “What is a Marketing Qualified Lead?” can be asked. What are the different stages of the opportunity process? Recognize discrepancies, multiple records, and contradictory information. Define KPIs and success metrics aligned with revenue outcomes.

Days 31-60

Shift to connection and cleansing. Integrate data enrichment platforms with CRM. Establish automated workflows where new accounts trigger enrichment jobs filling missing fields. Fill in the missing data fields by enriching the existing database. Carry out a bulk enrichment of current account and contact records with the prioritization of high-value segments. Establish bi-directional dataflows. Make sure that modifications in the operational systems get synchronized with the central hub and then get distributed to other connected platforms.

Days 61-90

Activate and optimize. Train teams on new unified data access. Show sales reps how to access complete account intelligence. Demonstrate to marketing teams how intent signals inform campaign targeting. Build dashboards using enriched data. Replace old reports with new views leveraging complete firmographic, technographic, and intent information. Set up governance and data quality protocols. Agree on who data stewards will be and what their roles and responsibilities will be. Assess the influence on sales and marketing productivity. Monitor the time saved from data searching. Work out the rise in connect rates and meeting bookings.

Those companies that manage to finish this phase generally experience quicker pipeline velocity, better cross, team alignment, and more accurate forecasting. Companies disclose 40 percent rises in sales efficiency that have been energised by clean data foundations.

Conclusion

RevOps is no longer an operational function. The foundation of revenue growth strategy is having a unified RevOps data infrastructure. Organizations that use disparate datasets will fail in their attempt to grow, their ability to forecast accurately, and their ability to personalize engagement with customers. When organizations create a RevOps data infrastructure, they benefit from an accelerated decision-making process, improved conversion rates, more accurate forecasting, and better alignment between marketing, sales, and finance functions. The development of scalable, dependable growth engines requires a single source of truth as the cornerstone.