Tag Archives: B2B data strategy

Business professional reviewing dashboards and reports to improve B2B data prioritization and identify high-value GTM signals

B2B Data Prioritization: The GTM Signal Problem

Modern GTM teams are not losing to data scarcity, they are losing to a failure of B2B data prioritization. The average sales team now has access to 12.7 data sources per account and 47 individual data points per prospect. Cold outbound conversion rates remain at 2.3%, while time-to-close has increased 18% over two years. More data is not producing better decisions. It is producing slower ones.

Data does not make for better decisions; data makes for slower decisions.

A 2024 audit on 40 revenue GTM teams found that 68% of data points in CRMs remained unused for routing, sequencing, or scoring decisions. 82% of enrichment fields were used only for display, never for decision-making. 41% of intent-driven campaigns did not adjust their cadence, content, or offer based on the intent signals they purchased. Organizations are collecting data they never act on, and treating the data they do act on as if every signal carries equal weight.

That assumption, that all data matters equally, is one of the most expensive operational errors in modern B2B go-to-market design.

What B2B Data Prioritization Actually Means & Why It’s a Revenue Question

B2B data prioritization is not a data quality effort. It is a revenue design question.

A field or signal is high priority not based on its cleanliness or completeness, but rather if it makes a GTM decision better, correlates with pipeline results, and impacts behavior measurably. And by that definition, very little of what populates a CRM would fit.

An effective operational model breaks down data into three categories:

Critical data directly predicts conversion probability or accelerates deal velocity. This includes verified buying intent signals, budget authority indicators, active technology evaluations, organizational triggers such as funding events or leadership changes, and decision-maker contact accuracy. When these signals disappear, pipeline degrades. They deserve immediate enrichment, real-time validation, and primary placement in every workflow.

Secondary data provides context and supports personalization but does not independently trigger action. Industry vertical, company size, historical engagement patterns, and secondary technographic layers all belong here. They improve outreach quality once Tier 1 data has confirmed an opportunity is worth pursuing. They should inform messaging, not prioritization sequencing.

Low-value data has weak or zero correlation with conversion in your specific sales model. Outdated firmographics, bulk contact scrapes, generic website visit history, and intent topics misaligned with your product category fall into this tier. Closed-won regression analysis is the clearest diagnostic: any field appearing in fewer than 15% of won deals with no measurable velocity impact should be deprioritized or retired.

The distinction between these tiers is not academic. One SaaS company tracked data consumption across their SDR team and found that reps reviewed an average of 23 fields per prospect during research. Closed-won analysis showed only 6 of those fields correlated with conversion. Across 1,200 monthly outreach targets, the 17 irrelevant fields cost 78 hours of productive selling time per month.

Why B2B Data Prioritization Fails: Three Structural GTM Breakdowns

Three structural failures prevent B2B data prioritization from taking hold in most organizations.

The first is volume without filtering. A 2024 benchmark study, by Syncari, of 90 B2B GTM stacks found the median team maintained 72 data fields per account, integrated 12 external data sources into CRM or a CDP, and ran 8 or more scoring or segmentation layers. Enrichment APIs add another 15-20 attributes automatically, with no built-in mechanism to filter by revenue relevance. When teams are overwhelmed, they fall back to defaults: relying on a single composite score without understanding which signals drive it, or building sequences on arbitrary “enriched accounts” lists that treat every record as equally actionable.

The second failure is the absence of prioritization frameworks. Most organizations categorize data by source or type rather than business impact. CRM fields display alphabetically or by creation date. Without a formal taxonomy of critical versus secondary versus low-value data, decisions about what to track and act on are made ad hoc. One demand generation manager described the problem directly: “Our enrichment workflow triggered on 18 data points. Marketing automation scored leads using 12 attributes. But pipeline regression showed only 4 fields mattered: employee headcount, technology stack category, funding stage, and intent topic strength. We were enriching 78% unnecessary data at $0.40 per API call.”

The third failure is strategic misalignment. A cybersecurity vendor purchased an intent data platform tracking over 400 topics, then routed every account showing any intent signal to sales. SDRs received leads researching “what is endpoint protection” alongside accounts actively evaluating vendors. Of 2,800 monthly intent-flagged accounts, only 47 became qualified opportunities, a 1.7% conversion rate. The platform cost $78,000 annually. Effective cost per qualified intent lead: $1,660. The problem was not the data. It was the absence of prioritization logic distinguishing genuine evaluation signals from low-value educational research.

The Volume-vs-Accuracy Trade-Off: Why More Signals Undermine GTM Data Prioritization

One of the most consequential misconceptions in B2B intelligence is that broader coverage improves outcomes. It often does the opposite.

Volume-centric data strategies attempt to possess a record for every account in a market. The result is high data decay, diluted accuracy, and signal overload. A database that is 90% complete but architecturally flat, where a funding alert carries the same weight as a LinkedIn page view, produces less actionable intelligence than a smaller, validated dataset of genuinely in-market accounts.

The trade-off is illustrated best in intent data. Without any filters, when intent signals are directed toward the sales department, the conversion rates are drastically affected by volume. You can read more here.

A martech platform that had been using Bombora had been directing 400 intent flagged leads each month to the SDR department. However, after introducing topic relevance scoring and surge intensity filters, only 80 leads were qualified to be contacted right away. The conversion rates shot up from 3.1% to 11.8%.

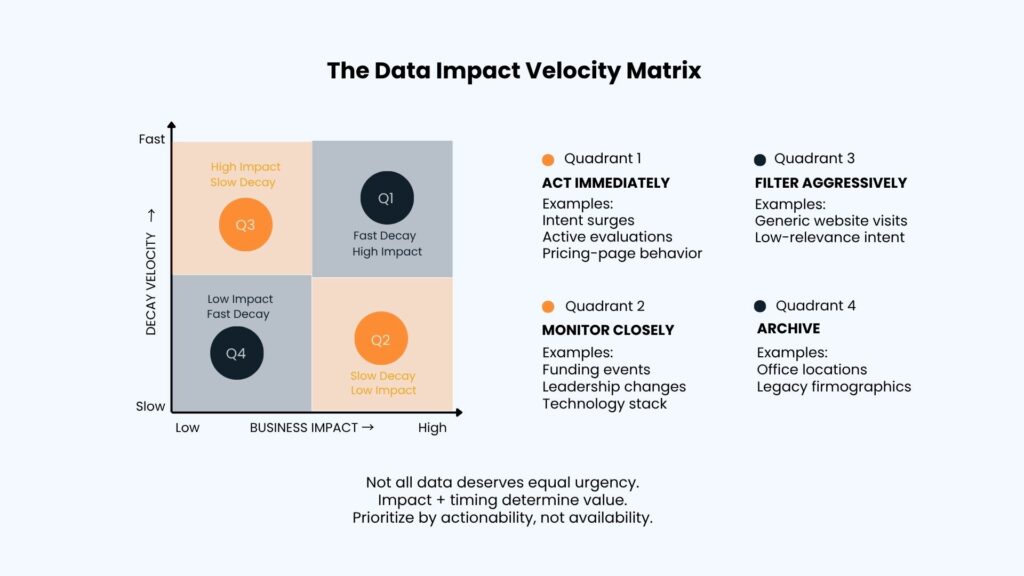
The Data Impact Velocity Matrix, a framework for evaluating incoming signals along two dimensions, business impact factor and decay velocity, formalizes this logic. Direct contact points such as verified direct-dials and corporate emails score high on both dimensions: they are critical for conversion and decay at roughly 30% annually as professionals change roles. Active intent signals score highest on decay velocity, with a buying window of two to six weeks, making immediate routing essential. Firmographic data decays slowly and warrants only quarterly or biannual batch enrichment. Generic context data, such as aggregate office locations or company news feeds, adds minimal value and should be suppressed from primary execution systems entirely.

A Revenue-Aligned B2B Data Prioritization Framework

Effective B2B data prioritization requires a scoring model that connects data attributes to revenue outcomes rather than data availability.

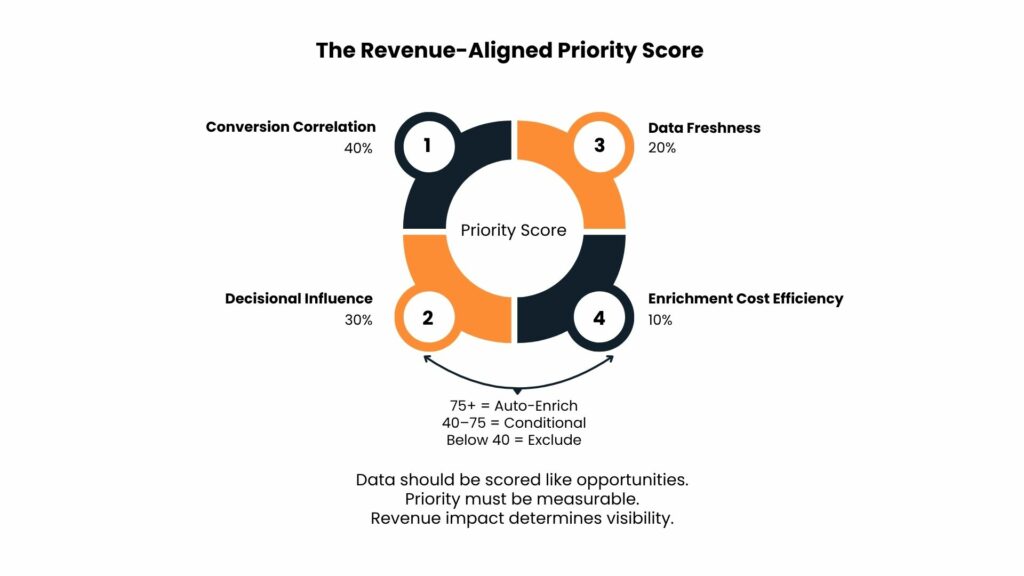
The Priority Score formula weights four components: conversion correlation (40%), decisional influence (30%), data freshness (20%), and enrichment cost efficiency (10%). Conversion correlation measures the statistical relationship between attribute presence and closed-won status. Decisional influence captures how frequently the attribute appears in qualify or disqualify decisions, measured through CRM workflow analysis. Data freshness scores recency inversely, with a 90-day refresh scoring 1.0 and data over 365 days old scoring 0.2. Enrichment cost efficiency captures revenue generated per dollar spent acquiring that data point.

Attributes scoring above 75 receive automatic enrichment and primary CRM visibility. Scores between 40 and 75 enrich conditionally based on account fit. Below 40: exclude from standard workflows.

This process was adopted by another software company, which found out that “active job postings” had been classified under Tier 1 because of its high correlation with growth and purchasing power potential. However, the quarterly assessment showed that correlation levels went down from 0.68 to 0.34 because of the effects of hiring freezes on the target market population. Consequently, job postings were re-classified under Tier 2 and the company shifted its focus to changing the technology stack that now correlated at 0.71.

Operationalizing B2B Data Prioritization: Four Mechanisms That Drive Pipeline

Tiered enrichment workflows replace universal enrichment with conditional logic. High-fit accounts with strong ICP match and buying signals trigger comprehensive enrichment across all Tier 1 and Tier 2 fields. Medium-fit accounts enrich Tier 1 only. Low-fit accounts receive minimal enrichment sufficient for disqualification confirmation. A healthcare IT company applied this approach across 1,400 monthly leads. Previous universal enrichment cost $3,920 per month. Tiered enrichment cost $2,156, a savings of $1,764 monthly, while improving data relevance for the accounts that actually mattered.

CRM field prioritization restructures how information is surfaced to sales reps. A primary view displays only Tier 1 data, six to eight fields, and serves as the default. Secondary views add contextual fields. Complete views include everything but require deliberate access. One implementation reduced average CRM page load time by 40% and increased Tier 1 data review rates by 63%, measured through field-click tracking in Salesforce analytics.

Intent signal filtering applies topic relevance scoring and surge-intensity thresholds to separate genuine evaluation activity from low-value research behavior. High-priority intent routes to immediate SDR follow-up. Medium-priority feeds nurture campaigns. Low-priority intent remains in the database but triggers no workflow action. This filtering, not intent data quality, is what determines whether intent platforms deliver pipeline.

Prioritization calibration on a continuous basis is performed using closed-won analysis at a quarterly rate, focusing on those attributes that recur most often in winning opportunities and those that have lost relevance due to changes in the market environment. Data significance is dynamic; attributes that contribute to conversions today can cease to be relevant tomorrow.

Practical Recommendations for RevOps Leaders

Run a data-relevance audit before investing further in enrichment, this is the foundation of any B2B data prioritization effort. List every data source, field, and signal your GTM systems consume. Calculate a relevance score for each using impact on pipeline, usage rate across routing and sequencing workflows, and statistical predictive power. Any field that has not driven a routing or sequencing decision in 90 days is not Tier 1.

Reduce data overload by deprecating low-value fields in execution systems. One organization reduced their enrichment map from 87 fields to 18 core decision-driving fields. Pipeline and velocity held flat. Data maintenance overhead dropped by 40%. Less active data is not less intelligence. It is cleaner execution.

Map each Tier 1 signal to a specific GTM action. A funding alert should trigger SDR outreach within 24 hours. A decision-maker job change should route to account-specific sequencing. An active pricing page visit should elevate an account’s intent score above the workflow threshold. If a signal cannot be mapped to a specific action with a measurable expected outcome, it is not Tier 1.

Build workflows around four to eight high-value fields rather than comprehensive data sets. One RevOps team found that using only four prioritized firmographic and intent fields in routing increased pipeline from high-value accounts by 23%, while fields kept for display only with no routing logic had no measurable impact.

Review priority areas on a quarterly basis. With changes in GTM strategy, there is a need to shift priorities. Have quarterly review sessions to ensure asset recategorization, reweighting of signals, and obsolescence of uncorrelated data fields.

Conclusion: Revenue Belongs to the Focused, Not the Comprehensive

The competitive edge in B2B intelligence is not moving toward organizations with the most data. It is moving toward organizations with the clearest understanding of which data drives decisions and which data consumes attention.

Implementing B2B data prioritization typically improves research efficiency by 30-45%, reduces enrichment costs by 25 to 40%, and increases conversion rates by 15 to 30% by concentrating sales capacity on genuine buying signals. These are not marginal gains. They are the operational difference between a GTM system that compounds efficiency and one that compounds complexity.

Not all data deserves equal attention. Most data deserves none at all. The organizations that outperform will not be those that collected the most signals. They will be those that built the discipline to know which signals to act on, which to archive, and which to stop buying entirely.

Digital analytics dashboard visualizing performance metrics and insights related to B2B data cost efficiency and revenue optimization

The B2B Data Cost Efficiency Problem: Why Data Spend Does Not Correlate with Revenue Outcomes

B2B data cost efficiency has become one of the most overlooked levers in modern revenue operations. The average B2B company now spends $178,000 annually on data solutions and subscriptions; 34% more than three years ago, while pipeline velocity has dropped 8% and conversion rates have flatlined.

In a benchmark study conducted in 2025 among 150 data-driven B2B organizations, it was discovered that only 28% of firms which had a 42% rise in data expenditure were able to improve their revenues per sales rep. This is not an execution failure. It is a structural one.

The B2B data market has expanded into a fragmented ecosystem where the average company manages 15 or more separate data vendors. When 72% of sales teams pay for data features they never activate and 76% of RevOps organizations do not track revenue impact by data source, the problem is not a lack of information. It is a lack of efficiency.

The core issue: organizations optimize for data volume while ignoring data utility, activation rates, and alignment with actual go-to-market (GTM) execution.

Why Higher Data Spend Kills B2B Data Cost Efficiency

Each of these failure modes degrades B2B data cost efficiency in a distinct way.

The Three Recurring Failure Modes

Higher spend concentrates around three recurring failure modes, each compounding the others.

Redundant vendor purchases inflate costs without expanding coverage. Most revenue organizations run six to twelve data tools simultaneously: a primary database, enrichment API, technographic layer, intent platform, email verification service, and point solutions for specific verticals. These platforms frequently pull from the same upstream data brokers. A 2025 analysis of 40 sales-stack audits found that 73% of companies had at least two independent enrichment vendors, and 56% had two or more intent platforms. Yet only 31% could confidently identify which vendor drove materially better outcomes.

One middle-tier SaaS firm with Cognism, ZoomInfo, and Apollo running simultaneously saw that 47% of its target account contacts were common to all three platforms. The combined annual spend on these tools totaled $143,000. The unique coverage achieved because of this overlap: 8%. The additional spend amounted to $67,000 annually with zero pipeline value.

The Utilization and Alignment Gap

Low activation rates silently destroy ROI. The industry average for database utilization sits at 12% to 18%. Organizations purchase enterprise licenses based on projected coverage needs but activate only a fraction. A healthcare technology firm was able to quantify this in great detail – its $92,000 yearly investment in enrichments equated to 840,000 API calls. Post-enrichment analysis revealed that 340,000 API calls were enriching contacts who were scoring below the client’s minimum ICP threshold, and 190,000 calls were enriching contacts tagged “do not contact” or in dormant segments for 18 months. Utilization: 37%

GTM misalignment converts quality data into expensive noise. Data purchases often proceed independently of strategy changes. Sales teams buy databases optimized for outbound at scale while the company pivots to account-based strategies. Marketing acquires intent signals for accounts that SDRs are not assigned to. When data outputs live in dashboards instead of playbooks, routing rules, or performance targets, spending on data without changing behavior changes nothing.

Volume vs. Accuracy: The Data Efficiency Trade-Off That Shapes Pipeline ROI

The instinct to purchase larger databases is understandable but consistently counterproductive. Volume creates an illusion of capability while masking the cost of poor quality.

Consider two scenarios. A company with 80,000 CRM records spending $90,000 annually on data, with a typical usability rate of 35%, pays $3.21 per usable record. A smaller database of 40,000 records with 55% usability costs just $2.50 per usable record. Volume is not value. It is a larger surface area for the same underlying problems.

This trade-off intensifies with intent signals. Intent data is one of the biggest drivers of modern data spend and one of the least efficiently used. Organizations ingest thousands of unstructured third-party signals weekly without internal filters. An enterprise software firm might receive an alert that a target account is searching for “cloud security,” but if the provider cannot identify which business unit is executing that search, sales teams cold-call generic contacts. The result is low conversion, wasted capacity, and data spend that drives activity without driving revenue. You can read more here.

High-accuracy, lower-volume datasets consistently outperform high-volume generalized databases in pipeline contribution. One financial services company spent $67,000 on an 18,000-contact healthcare vertical database. Six months later, it generated $180,000 in pipeline from 11 accounts, all of which were already known and engaged. Meanwhile, their underfunded enterprise motion produced $4.2M in pipeline from a $12,000 investment in executive intent data targeted at existing customers in expansion phases. Precision won by a factor of 35 on pipeline ROI.

The Data Activation Matrix: Measuring B2B Data ROI Across Every Vendor

Most organizations lack formal efficiency metrics for data investments. That gap prevents optimization. Three metrics, tracked together, that form the foundation of any B2B data cost efficiency framework and expose where value erodes.

Cost Per Usable Record (CPUR) reveals the true price of quality. The formula accounts for total investment against records that actually meet accuracy and delivery standards:

CPUR = (Tool Cost + Labor Cost + Decay Cost) / (Number of Records * Usability Ratio)

An organization investing an extra $14,000 in tools for improving data quality but lowering the cost associated with labor by $10,000, as well as boosting usability from 55% to 78%, will lower its cost per record usage from $2.50 to $1.89. This is compounding data infrastructure.

Cost Per Activated Account (CPAA) measures GTM alignment. For an account to count as activated, it must enter a meaningful sales motion, not just exist in a list or scoring dashboard. This metric exposes inefficiencies where data is purchased at scale but activation rates remain low, or where one vendor shapes actual plays while another is ignored despite similar contract value.

Pipeline Impact Per Dollar of Data Spend is the most strategic metric and the hardest to calculate. It requires tagging pipeline by data source and comparing performance against a baseline. Organizations that attempt this consistently find that a minority of vendors drive the majority of incremental pipeline, and that some high-cost “table-stakes” products produce no measurable lift when removed.

A useful triage framework maps vendors across two dimensions: value (pipeline generated per dollar) and efficiency (CPUR or CPAA). Vendors that are low-value and low-efficiency are candidates for elimination. High-value but low-efficiency vendors merit closer scrutiny and usage optimization. High-value, high-efficiency vendors deserve consolidation of spend and negotiating leverage.

Four Shifts That Recover 25-40% of Wasted Data Spend

Organizations that improve B2B data cost efficiency follow a consistent approach.

Focus on a core-with-specialties approach. Replace the patchwork of multi-vendor systems with a layered approach consisting of one general vendor that provides coverage overall, plus one or two specialty vendors with differentiating capabilities such as deep verticals, international reach, or intent signals. By focusing on two vendors as opposed to seven, a logistics software company was able to lower its costs from $156,000 to $89,000 while improving contact uniqueness coverage by 12%.

Route inbound leads through a low-cost validation layer first: check for valid email format, filter personal domains, remove duplicates. Only verified enterprise leads proceed to premium API enrichment. This ensures high-cost API credits are spent on viable, sales-ready opportunities rather than junk sign-ups or personal email addresses.

Build performance-based vendor evaluation into renewal cycles. Measure accuracy rate, data freshness, and pipeline correlation for every vendor, updated quarterly. Vendors scoring below a defined threshold enter performance review. Vendors that cannot demonstrate measurable pipeline contribution should not receive automatic renewals. This approach prevents incumbent inertia, the tendency to renew underperforming vendors due to switching friction.

Embed data into GTM workflows rather than adjacent to them. Scoring, routing, sequencing, and playbooks must be driven by data, not informed by it after the fact. A 2025 case study found that a 25% increase in the fraction of SDR time spent on data-driven accounts led to a 19% increase in pipeline per salesperson with no change to the underlying data budget. The efficiency gain came from usage, not volume.

Data Cost Efficiency Is the GTM Competitive Advantage

The modern GTM environment is not short on data. It is short on economically effective intelligence systems.

Organizations that keep increasing their number of records, suppliers, and data signals without getting better at activating and making decisions based on data will experience increasing expenses and inconsistent commercial results. Organizations focused on B2B data cost efficiency; not just data volume, consistently recover 25-40% of wasted spend.

The recovered capital, often $50,000 to $150,000 annually, funds higher-impact revenue initiatives with measurable ROI.

Data cost efficiency is not a procurement metric. It is a revenue strategy. The question is not whether your data budget is large enough. It is whether your data investment is actually changing decisions, improving execution, and driving pipeline that closes.

Business professionals reviewing analytics dashboards and performance metrics to improve data-driven decision making across teams

Data-Driven Decision Making: Closing the Analytics Gap

Revenue operations leaders struggle with data-driven decision making despite massive infrastructure investments. Organizations deploy intent platforms, enrichment APIs, and real-time analytics, yet strategic decision quality remains stagnant.The problem is not data scarcity. It is decision inefficiency.

A 2025 study of 750 business leaders found that 58% say key decisions are based on inaccurate or inconsistent data most of the time. More concerning: 65% believe no one at their organization fully understands all collected data or how to access it. Between 60% and 73% of enterprise data goes unused for analytics, while up to 90% of dashboards eventually become abandoned digital assets.

This is the data decision gap: the disconnect between generating insights and executing decisions that change business outcomes. In go-to-market systems, this gap directly impacts pipeline velocity, conversion rates, and revenue predictability.

What the Data-Driven Decision Gap Actually Means

Data-driven decision making fails when insights don’t translate to action. The data decision gap is the organizational failure to convert analytical outputs into timely, confident business actions. It manifests in three critical patterns.

First, insight availability without decision clarity. A demand generation team identifies that enterprise accounts from financial services convert at 3.2x higher rates than other segments. The insight is clear. The decision is not. Does this mean reallocating all outbound resources? Adjusting pricing? Changing content strategy? Without a decision framework, insights become conversation topics rather than action triggers.

Second, analysis complexity creating decision hesitancy. When sales operations receives a quarterly review tracking 17 metrics across six regions, cognitive overload produces decision avoidance rather than better choices. Research from the Corporate Executive Board found that providing more information decreased purchase confidence by 23%. The same principle applies internally.

Third, time lag between insight generation and decision relevance. Customer success discovers through cohort analysis that accounts without executive engagement in the first 90 days churn at twice the baseline rate. By the time this insight reaches decision-makers and gets operationalized into playbooks, the current cohort has already passed the 90-day window. The insight was accurate but temporally disconnected from its moment of utility.

Organizations optimize for analytical comprehensiveness rather than decision speed and clarity. This is the core failure.

Why the Data Decision Gap Exists

Three structural deficiencies prevent data from translating into decisions.

Lack of interpretation frameworks. Data answers what is happening but not what should be done. When pipeline velocity decreases by 12%, that number alone does not indicate whether the problem stems from lead quality degradation, sales capacity constraints, or deal complexity increases. Without established frameworks that translate metrics into diagnostic categories, each insight triggers a new investigation rather than a predetermined response.

High-performing revenue teams implement decision architectures: pre-defined logic connecting specific data patterns to decision options. For example, if MQL-to-SQL conversion drops below 18% for two consecutive weeks and lead source distribution has not changed, then audit lead scoring criteria and contact SDRs for qualification feedback within 48 hours.

Unclear decision ownership. Data democratization promised better data-driven decision making but created insight accessibility but dissolved decision accountability. A SaaS company analyzed why expansion revenue consistently underperformed despite accurate usage data predicting expansion propensity. The root cause was organizational. Customer success saw expansion signals, but account executives controlled the commercial relationship. Neither team had clear authority to act, so both analyzed repeatedly without executing.

Forbes Council research confirms this pattern: 77% of business leaders say dashboards and charts they receive do not directly inform their decisions. According to Gallup, only 21% of employees strongly agree they have performance metrics within their control.

Over-engineered analysis for under-specified decisions. Revenue teams often pursue analytical sophistication that exceeds decision complexity. Building a machine learning model to predict deal close probability with 87% accuracy sounds valuable until you recognize the business decision is binary: prioritize this deal or do not. If the threshold for prioritization was 70%, the additional 17 points of precision consumed weeks of resources without improving decision quality.

Impact on GTM Performance and Revenue

The decision gap erodes revenue across three dimensions.

Velocity degradation through decision bottlenecks. Revenue intelligence analysis of 200 B2B companies found that organizations in the slowest quartile for internal decision-making had 34% longer sales cycles than the fastest quartile, even when controlling for deal size and industry. The delay was not in customer decision-making. It was in seller decision-making about discount approvals, contract terms, and resource escalation.

Opportunity cost from missed timing windows. Intent signals decay rapidly. Bombora research shows buyer intent signals have a half-life of 7 to 12 days depending on signal strength. Marketing teams that take three weeks to decide on campaign adjustments based on intent data are optimizing for opportunities that have already moved to competitors. The analysis was accurate when generated. It became irrelevant before execution.

Resource misallocation from strategy-execution lag. A technology company identified that inside sales closed deals 40% faster than field sales for accounts under $50K ARR, suggesting a channel strategy shift. Operationalizing that insight required decisions about compensation restructuring, territory reassignment, and customer communication that took two quarters to finalize. During those quarters, the company continued staffing the less efficient channel at full capacity, burning approximately $800K in excess cost of sales.

The Decision-Ready Data Framework

Bridging the gap requires restructuring how organizations prepare data for data-driven decision making, not just analysis. The Decision-Ready Data Framework operates on three principles.

Decision-backward design. Start with the decision, then specify data requirements. Not what insights can we extract, but what decision needs to be made and what is the minimum viable data set to make it confidently. For quota setting, this means prior year attainment by territory, territory-level pipeline coverage ratio, and rep tenure. Excluded: individual deal narratives, competitive intelligence reports, product roadmap details. These might be interesting but do not change the quota decision.

Insight-to-action mapping. Every analytical output should include an explicit decision prompt. Replace “Enterprise segment conversion rate decreased 8% quarter over quarter” with “Enterprise segment conversion rate decreased 8% QoQ, decision required: investigate lead quality with marketing or adjust sales training focus, decision owner: VP Sales, decision deadline: end of week.” This forces clarity on what decision the insight enables, who has authority to make it, and what the decision timeline is.

Confidence thresholds over precision maximization. Establish the confidence level required for each decision category, then stop analyzing when that threshold is met. A demand generation team implemented confidence thresholds for channel budget decisions: 50% confidence to reallocate up to 10% of monthly budget, 70% confidence to reallocate up to 25%, and 85% confidence to eliminate a channel entirely. This created decision speed. The team moved from quarterly optimization requiring 90% statistical significance to monthly optimization accepting lower confidence for lower-stakes decisions.

Operationalizing Data-Driven Decisions

Three operational mechanisms convert framework into practice.

Embedded decision workflows. Insights must enter operational workflows, not standalone reports. A customer success platform integrated churn risk scores directly into weekly account review meetings with pre-populated decision options: escalate to executive sponsor, offer product training, adjust check-in cadence, or monitor. The CS team stopped receiving churn reports and started receiving decision queues.

Decision velocity metrics. Track time-from-insight-to-decision alongside traditional business metrics. A marketing operations team measured insight age: how many days elapsed between identifying an attribution problem and implementing a campaign adjustment. They set a target of less than 14 days for non-structural issues. Tracking decision latency created accountability for bottleneck identification.

Retrospective decision audits. Quarterly, review major decisions against outcomes to calibrate confidence requirements. Did decisions made at 65% confidence produce worse outcomes than those made at 85% confidence? If not, lower the analysis threshold. This prevents analytical over-engineering and builds organizational confidence in faster decision-making.

Practical Steps to Improve Data-Driven Decision Making

Start with the decision, not the data. Before any analysis, ask what decision this will inform and when it needs to be made. If the answer is unclear, the analysis should not proceed.

Assign ownership to every metric. For each KPI on your executive dashboard, there must be a named individual accountable for acting when it moves outside acceptable ranges.

Reduce dashboard complexity. Audit your dashboard portfolio quarterly. Remove what is not driving action. Focus on decision-driving insights, not monitoring metrics.

Automate action where possible. Build workflows that trigger action automatically when predefined conditions are met. Do not wait for humans to interpret signals.

Measure decision impact, not data accuracy. Track pipeline improvements and conversion changes resulting from data-driven decision making. If you are not measuring the result of the decision, you are not doing data-driven business.

Conclusion: Data Must Drive Action, Not Just Analysis

The competitive advantage in modern revenue operations is not data volume or analytical sophistication. It is decision velocity calibrated to business impact. Organizations that treat treat data-driven decision making as a revenue accelerant rather than an analytical end state compress the insight-to-action cycle and translate information advantage into revenue performance.

You can read more here.

The data decision gap closes when revenue leaders ask not what does the data say but what will we do about it, by when, and who decides. That shift from analysis as the goal to decisions as the output transforms data from a reporting function into a revenue driver. In the intelligence era, the distance between knowing and doing is the primary measure of organizational health.

Analysts reviewing multiple records and source materials, illustrating the risks of data risk concentration when organizations rely on too few data sources

The Data Risk Concentration Problem: Why Over-Reliance on Few Data Sources Creates Vulnerability

Data risk concentration is silently crippling B2B revenue teams. Your enrichment vendor has been your sole source of firmographic data for three years. Your intent signals come from a single platform. Your CRM enrichment runs through one API. Then, without warning, that vendor throttles their service, changes pricing, or experiences an outage. Your GTM engine doesn’t slow down; it stops.

According to Gartner’s 2024 Data & Analytics Survey, 68% of B2B organizations source more than 70% of their contact and firmographic data from just one or two providers. When a major B2B SaaS company lost access to their primary enrichment provider for 72 hours in 2023, the result was immediate: $1.2M in pipeline delays and a 34% drop in qualified meeting bookings that quarter. The issue wasn’t poor execution. It was architectural fragility driven by data risk concentration.

What Data Risk Concentration Means for B2B Revenue Teams

Data risk concentration occurs when critical revenue functions depend on a narrow set of data sources. This manifests in three distinct patterns that compound to create systemic vulnerability.

Provider concentration happens when a single vendor supplies the majority of your contact data, technographic intelligence, or intent signals. If that provider experiences quality degradation, coverage gaps in your target market, or service interruptions, your entire go-to-market motion inherits that vulnerability. Research shows that organizations relying on one or two dominant sources often experience higher volatility in data quality and availability, especially when those sources change policies or degrade coverage.

Pipeline concentration emerges when multiple downstream systems like CRM enrichment, marketing automation, sales intelligence platforms, all pull from the same upstream source. A single error propagates across every tool in your stack. When one major provider experienced a data ingestion delay in 2024, thousands of customers simultaneously saw stale job change alerts, outdated contact information, and delayed intent signals across every integrated platform.

Dataset concentration is subtler but equally dangerous. Many organizations use providers that aggregate from overlapping sources. What appears to be diversification, using three different vendors, is actually redundancy when all three scrape the same LinkedIn profiles, parse the same corporate websites, and monitor the same intent networks. According to Forrester’s 2024 B2B Data Ecosystem Report, 73% of organizations using three or more data providers don’t realize those vendors share upstream sources for 40-60% of their data.

The compounding effect makes concentration dangerous. A sales team relying on a single enrichment API for contact validation, the same provider’s Chrome extension for prospecting, and that vendor’s intent data for prioritization has created a three-layer dependency on one data infrastructure. When quality degrades or coverage shifts, every workflow breaks simultaneously.

Why Data Risk Concentration Happens: The Economics of Vendor Consolidation

Data risk concentration isn’t accidental. It’s driven by rational economic and operational incentives that create risk as a byproduct.

Convenience economics favor consolidation. Enterprise data contracts offer volume discounts that make single-vendor relationships 30-40% cheaper than multi-source strategies. One contract, one integration, one invoice. IT teams support this logic: fewer APIs to maintain, simpler security reviews, reduced integration complexity. According to vendor management research, 68% of technology leaders are actively planning to reduce their vendor count by 20%, driven by operational complexity.

Integration debt accelerates the problem. Once your CRM enrichment, sales engagement platform, and marketing automation all connect to the same provider, switching costs compound. Each additional workflow built on that foundation raises the switching threshold. By the time concentration becomes obvious, you’ve built too much on top to easily diversify.

Quality perception bias masks the risk. Teams often consolidate around whichever provider solved their initial data problem most effectively. But data quality is domain-specific. A provider with excellent direct-dial accuracy may have weak technographic coverage or stale funding data. Over-indexing on initial positive experience leads to scope creep without due diligence.

The most dangerous driver is invisible correlation. Teams believe they’re diversified when they’re not. When asked to map source lineage, only 18% of revenue operations leaders could identify which providers used independent collection methodologies versus aggregated resellers. This creates false confidence in diversification that doesn’t exist.

Business Impact: When Data Risk Concentration Causes System Failure

The consequences of data risk concentration materialize across three dimensions: disruption, reliability, and perspective.

Disruption risk is the most visible failure mode. A mid-market cybersecurity vendor relying exclusively on one enrichment provider lost API access during a billing system migration in 2024. For six days, their lead routing broke, form submissions went unenriched, and their SDR team operated blind. The calculated impact: 412 leads stuck in processing, 67 qualified opportunities delayed past SLA, and an estimated $840K in pipeline pushed to the following quarter.

Reduced data reliability follows from lack of cross-validation. When you have only one source, you have no way to verify its accuracy. One enterprise sales organization discovered their primary data vendor had 62% contact accuracy in their core mid-market technology segment but only 31% accuracy in healthcare, their fastest-growing vertical. Because all prospecting, enrichment, and intent workflows used that single source, they’d been systematically deprioritizing their highest-potential accounts for eight months. The opportunity cost: $3.2M in addressable pipeline they never activated.

Limited perspective risk is the most insidious because it doesn’t look like failure, it looks like your data. A revenue operations leader at a marketing automation company discovered this when they layered a second intent provider for comparison. The overlap was only 34%. Both providers showed statistically significant intent signals but for almost entirely different account sets. Neither was wrong, but relying on just one meant missing two-thirds of the addressable in-market opportunity. When they activated the previously invisible segment, pipeline velocity increased 28% and win rates improved 12%.

The Data Source Diversification Framework

Building resilient data architecture requires a structured approach to identifying, assessing, and mitigating concentration risk.

Layer 1: Dependency Mapping

Document every revenue-critical workflow and its data dependencies. For lead enrichment, account prioritization, contact discovery, intent monitoring, and technographic intelligence, trace back to originating sources. Create a dependency matrix showing which vendor supplies each data point for each workflow. If one provider appears in 60% or more of cells, you have critical concentration.

Layer 2: Source Lineage Analysis

Not all diversification is real diversification. Ask vendors directly: What percentage of your data is self-collected versus licensed from aggregators? Which specific sources contribute to your datasets? Providers using independent methodologies: proprietary web scraping, direct partnerships, behavioral tracking offer true diversification. Resellers create the illusion of backup without reducing correlation risk.

Layer 3: Use-Case Matching

Different workflows have different tolerance for risk. High-stakes precision workflows require maximum accuracy even at the expense of coverage. High-volume discovery workflows tolerate lower individual record accuracy in exchange for comprehensive coverage. Time-sensitive activation workflows require real-time freshness. Route each use case to the source best architected for its specific requirements.

Layer 4: Validation and Redundancy

Implement tiered sourcing by designating primary and fallback providers for essential workflows. Deploy variance monitoring to detect degradation before it impacts outcomes. When two independent providers historically agree on 75% of firmographic data but agreement suddenly drops to 62%, investigate whether one source has introduced errors. Variance is your early warning system for quality problems that would be invisible with a single source.

Practical Steps to Mitigate Data Vendor Dependency Risk

Mitigating data risk concentration starts with visibility.

Audit your data dependencies

Map every data source by type, vendor, and criticality. Identify single points of failure where one vendor supplies 100% of a critical data type.

Implement multi-source for Tier 1 data

For firmographics, intent signals, and contact data that drive pipeline decisions, maintain at least two sources. The cost of the second source is insurance against the cost of the first failing.

Build cross-validation into workflows

Don’t just collect multiple sources, compare them. Flag discrepancies. Investigate root causes. Track metrics like contact-level accuracy, account-level completeness, intent signal precision, and data freshness against your actual business outcomes.

Monitor vendor health continuously

Vendor performance degrades over time. Track API reliability, data freshness, and accuracy trends. Create data quality scorecards that measure provider performance against real-world results, not vendor-supplied claims.

Plan for fallback

Document what happens when each source fails. Establish contingency protocols before you need them. When disruption occurs, execute a plan rather than improvising under pressure.
You can read more about it here.

Conclusion: Resilience Requires Diversification

Data risk concentration is a structural vulnerability embedded in how most revenue organizations architect their data infrastructure. The shift to data-driven go-to-market strategies has created new dependencies that traditional risk management doesn’t capture. Your uptime isn’t just your own systems anymore. It’s also your data providers’ uptime.

Building resilient data architecture means accepting that perfect information doesn’t exist and single sources of truth are single points of failure. The goal isn’t eliminating all dependency, it’s ensuring no single dependency can create systemic collapse. In a market where data quality directly determines pipeline quality, concentration risk is revenue risk.

The organizations building durable competitive advantages aren’t those with the most data or the most expensive providers. They’re the ones who’ve architected redundancy, monitored variance, and built workflows that degrade gracefully rather than fail catastrophically when data sources shift. Because in revenue operations, the question isn’t “Whether your data will fail?”, it’s, “Whether your business can keep running when it does?”

Business professional analyzing multiple dashboards and analytics screens to transform raw information into actionable data context for GTM intelligence

Data Context: Transform Raw Data Into GTM Intelligence

You have 50,000 contacts in your CRM. You process millions of behavioral events in your data warehouse. There are 247 active leads on your dashboard. But your salespeople still can’t tell when customers are ready to purchase. Your marketing campaigns seem generic. And your forecasts are still a shot in the dark.

The problem isn’t data volume, it’s data context. Without context, even accurate data produces no results.

Industry statistics show that up to 80% of all enterprise data is never leveraged because it lacks any kind of context. People just aren’t able to apply this data into meaningful action. That’s the problem with data context, data that is accurate yet unable to produce results simply because it’s not contextualized within the business process and decision-making.

GTM is one area where this challenge makes an immediate impact.

What Data Context Means for GTM Teams

Data context consists of three interconnected layers that transform raw information into intelligence: Why is this data important? To whom does the data apply? And how should this impact on their decision-making process?

The business relevance layer connects the data to your unique GTM strategy. The significance of someone holding the director’s title varies in different organizations. A fundraise event will only have implications for expansion only if your product helps enterprises scale. Without such context, firmographic details such as industry and company size lack precision for segmenting customers.

The role context layer defines where a person fits in the buying decision process. Is the individual an influencer, decision-maker, or end-user? What is the significance of the same title in small firms versus large corporations? A VP of marketing role holds entirely different responsibilities when compared between a Series A startup and Fortune 500 company.

Usage context determines when and how data should trigger action. A product usage spike indicates expansion readiness only if it follows adoption of key features. A job change matters only if the new role has budget authority. Intent signals without buying stage context lead to misguided outreach.

As one analysis explains, without semantic definitions mapping business terms to precise data, teams improvise. They see a customers table and assume every row is a customer. These assumptions are wrong often enough to make systems unreliable.

Where Data Context Breaks Down in RevOps

The data context gap appears in four predictable areas across revenue operations.

Generic datasets provide standardized fields and broad coverage but not business-specific relevance. A typical B2B database delivers company size, industry, and job titles without growth stage, technology stack, or buying intent. According to analysis of intent data evolution, first-wave intent failed precisely because it lacked persona-level precision needed to identify actual buying group members. Sales received lists of hot accounts with no context on who to call or what their role-specific pain points were.

Lack of segmentation means treating all contacts within a title cohort as identical. Marketing targets all Marketing Managers without filtering by industry, company size, or intent. The result is diluted messaging and lower engagement.

Absence of linking prevents understanding relationships between data points. A funding announcement without hiring data does not indicate expansion capacity. A job change without company growth context does not signal authority. In most cases, there is intent data on one platform, technographic data in another, and the CRM history on yet another. In this case, because there is no connection between all these points, you may be seeing someone visiting the pricing page when they have just created a support ticket.

Over-reliance on raw fields leads teams to depend on individual attributes instead of derived insights. Using job title alone misses the value of combining role, influence level, and buying stage into a composite signal.

How Missing Data Context Impacts GTM Performance

Missing context cascades through every revenue function.

Poor targeting results from treating all accounts within firmographic bands as equal. Without growth stage, technology fit, and intent context, marketing campaigns reach companies that cannot buy. Sales teams prioritize accounts that will not convert. Campaigns targeting all Marketing Managers without context include low-fit segments, producing diluted messaging and lower conversion rates.

Weak prioritization means all leads receive equal treatment. High-value accounts get ignored while low-potential prospects consume resources. Without scoring based on intent plus fit, pipeline quality suffers. One analysis notes that without access to complete context, execution breaks down. A hyper-growth customer showing early churn signals needs proactive outreach before they start evaluating alternatives. None of these plays work effectively without deep, unified context about the account.

Ineffective decision-making follows from incomplete intelligence. A lead score based solely on engagement volume misses whether the engaged contact is a decision-maker. A territory plan based solely on company count misses growth trajectory. Leaders might allocate more budget to the region with the most leads, not realizing another region has leads with much higher contextual fit.

Operational inefficiency emerges when large datasets are processed without context. Low signal quality means wasted effort and increased customer acquisition costs. Scaling raw data without context leads to more noise, not more insight.

A Framework for Building Data Context in Your Stack

Building effective data context requires a four-layer approach:

Layer 1: Raw Data includes contacts, accounts, activities, and signals. It has high volume but low inherent meaning.

Layer 2: Enrichment adds firmographics, technographics, and intent signals to increase data depth. According to 6sense analysis, data enrichment solves the context problem by filling gaps and adding context that turns skeletal records into complete, actionable profiles.

Layer 3: Context transforms data into ICP alignment, account tiers, buying stage, and role relevance through scoring models, segmentation frameworks, and relationship mapping. This is where most teams stop at enrichment but high performers invest in true context because enrichment adds data while context adds meaning.

Layer 4: Decision connects data to actions, workflows, and campaigns through lead routing, outreach triggers, and prioritization queues.

According to the evolution of intent data, the fundamental shift is how data is used. Intent data is now the engine of signal-based revenue operations. When a high-value signal is detected, modern systems can trigger a nurture sequence, send an instant notification to the BDR, and populate an ad audience.

Making Data Actionable in GTM Systems

Adding context is necessary but insufficient. Context must be integrated into workflows to drive action.

Align with business goals before adding context. Every dataset should answer how this impacts pipeline. As one Chief Data Officer learned, data initiatives fail when they exist in isolation. The approach changed when they stopped treating data as a separate function and started embedding it directly into business strategy.

Integrate into workflows so context triggers action. Ensure data feeds into CRM actions, campaign triggers, and sales prioritization. Context viewed in reports is unused. Context embedded in CRM records, alert workflows, and campaign segmentation drives action.

Facilitate interpretation on a large scale with semantic layers to determine meaning. Avoid unnecessary analysis by offering explicit signals and pre-classified data types. Ensure consistency with standardized logic for all applications, including artificial intelligence, business intelligence, and analytics.
You can read more, here.

Strike a balance between coverage and relevance. Data quantity does not guarantee quality decision-making. Prioritize meaningful data over sheer numbers.

Data Context Implementation: RevOps Best Practices

Audit data usage. Identify which data fields actually influence decisions. Most organizations discover they are enriching for volume rather than decision-critical attributes.

Define context models explicitly. Create clear frameworks for ICP, segmentation, and prioritization. Build a semantic layer that defines what key terms mean for your business. Active lead, qualified account, and expansion opportunity must have precise, shared definitions.

Layer intent on top of fit. Firmographic fit tells you who could buy. Intent context tells you who is ready to buy now. Without both, prioritization remains guesswork.

Reduce raw data dependency. Shift from field-level analysis to derived insights. Create scores, categories, and segments instead of depending on individual attributes.

Standardize context across teams. Ensure consistent definitions and unified usage. When different teams operate from different contexts, marketing builds campaigns around generic personas while sales discovers actual decision-makers in conversations.

Measure context effectiveness. Track conversion improvements, targeting accuracy, and pipeline quality to validate that context is driving business outcomes.

Conclusion: Data Context Transforms Raw Data Into Revenue

Raw data is potential. Context is activation.

The organizations that scale successfully are not those with the most data but those that add the most relevant context, transforming fragments into insights, records into relationships, and signals into pipeline.

In modern GTM systems, data collection is easy and enrichment is scalable. But context remains the differentiator. Organizations that solve the data context problem move from noise to signal, from activity to efficiency, from data to revenue.

The question is not whether you have enough data. The question is whether you understand what it means. Because without context, you do not have intelligence. You have noise.

Developer analyzing system code highlighting structural data architecture risk in complex data environments

Structural Data Risk: When Architecture Becomes a Liability

Your sales intelligence platform processes 50,000 account enrichment requests daily without error. Lead scoring runs flawlessly. Every dashboard shows green. Then a single API endpoint fails at your primary data provider. Within 15 minutes, lead prioritization stops. Sales teams lose access to intent signals. Marketing continues targeting outdated accounts.

This is structural data architecture risk. It does not come from breaches or bad actors. It comes from the architectural choices themselves. One analysis prepared by the UK Cabinet Office in 2024, states that being over-dependent on a single supplier (e.g., AWS), could ultimately result in significant costs to public organizations (up to £894 million).

In 2025, due to Builder.ai filing for bankruptcy, their clients were unable to access any data overnight. Structural data architecture risk lives not in your security posture, but in how your data is organized, connected, and operated. It doesn’t show up on uptime reports. It shows up when something breaks.

How Structural Data Risk Hides in Working Systems

The most dangerous data architectures are the ones that appear to work. Enrichment batches are completed on schedule. Intent signal feeds populated dashboards. The machinery hums along, building false confidence while weaknesses compound beneath it.

In B2B intelligence operations, this pattern plays out consistently. A sales team’s CRM relies on one enrichment provider. That dependency remains invisible until the provider experiences an outage, changes its pricing, or gets acquired. Risk accumulates during normal operations. Every architectural choice that prioritizes efficiency over resilience adds to that accumulation.

This is how structural data architecture risk compounds silently, during normal operations, before anyone notices.

Four Types of Structural Data Architecture Risk to Know

Structural data architecture risk takes four primary forms in B2B sales intelligence environments.

Single Points of Failure

An example of this would be the security breaches that took place at Snowflake in 2024 that impacted hundreds of businesses at the same time. The ransomware struck CDK Global and left thousands of car dealerships for weeks with no way to utilize critical systems necessary for operating their business. From a B2B sales intelligence perspective, this manifests itself in organizations that rely on one single intent signal provider, one single contact enrichment service or one single CRM integration route.Eighty-two percent of enterprises report single-point failures as their leading cause of operational disruption.

Over-Centralization

Centralization simplifies management but concentrates risk. According to the Flexera 2025 report, 70% of companies use more than one cloud vendor to minimize risk; however, many of those same companies still keep their overall data intelligence architecture centralized, pooling their firmographic and technographic information along with all of their intent signals with one third-party vendor. So while infrastructure has redundancies built into it through cloud providers, all the data that supports the sales operational process remains at central risk due to the use of a single vendor.

Vendor Lock-In Dependencies

Custom API’s and proprietary data formats alone create a lock-in for Sales Intelligence Platforms. However, even on top of that, you also have vendor-specific lead scoring models that are trained on those data structures, integration workflows built around proprietary API’s, and non-portable historical data. As you use a platform for a longer period, the cost of migrating from that system increases exponentially. Vendors exploit these switching costs through price increases and unfavorable contract terms. Sixty-five percent of organizations report fearing the cost of leaving their primary data platform.

Manual Intervention Chains

Any data workflow requiring a human to validate or clean records before use introduces delay, error, and dependency on that person’s availability. When a pipeline breaks and recovery requires manual intervention, the timeline depends entirely on human speed and knowledge. Organizations that depend on reactive troubleshooting instead of proactive monitoring often find their manual processes are not able to scale during an incident. One incident exemplified this when a critical failure occurred in data replication, and because monitoring was not in place, the team did not detect the failure for months and only discovered it after the data had already degraded substantially.

How Structural Data Architecture Risk Surfaces in Operations

Outage Amplification

On July 2024, a faulty update from CrowdStrike resulted in 8.5 million Windows machines crashing worldwide. In Data Intelligence operations, amplification is viewed the same way. A minor API timeout at an intent signal provider does not just create a delay during one data pull. Rather, it blocks lead scoring algorithms, delays marketing campaign targeting, and prevents sales teams from accessing prioritized account lists. The original impact of that failure occurred minute by minute due to the many minutes of downtime. The business impact becomes many hours of paralyzed operations. For example, a customer in a Fintech CDP case had five days of downtime resulting in $4.2 million in lost customers due to the excessive centralization of their architecture.

Slow Recovery and Decision Paralysis

CDK Global extended its restoration after ransomware from late June into July because it had not tested the backup systems that existed on paper. Alternative workflows were undocumented. In sales intelligence terms: when AI-prioritized lead lists go dark, sales teams do not know which accounts to call. When intent signals disappear, marketing campaigns have no manual fallback. Organizations without a tested disaster recovery plan face recovery costs 2.3 times higher than those with regular exercises.

How to Audit Your Structural Data Architecture Risk

Dependency Mapping

Auditing your structural data architecture risk starts with a complete map of your data dependencies.

Document every data source feeding your intelligence platform, every API enabling integrations, and every vendor providing critical functions. Most B2B sales operations depend on five to ten external providers. Mapping reveals which components act as critical hubs. Answer these questions: which business processes fail completely if each vendor goes offline? What percentage of your account intelligence comes from a single provider? How quickly could you restore operations using alternative sources? The answers often expose fragilities executives did not know existed.

Failure Simulation

One of the first companies to develop chaos engineering was Netflix, purposely ruining a production system so they can find problems prior to them occurring. You can use this same discipline within your data architecture. You could isolate your primary intent signal source and see that your scoring model has no fallback logic, your marketing automation is hard failing instead of degrading, or that your sales team does not have any documented manual processes. One retail organization mapped 18 single points of failure through this exercise, prioritized six fixes, and avoided an estimated $1.9 million in outage costs.

Risk Scoring Frameworks

Score each data dependency across four dimensions: criticality to operations, availability of tested alternatives, difficulty of switching, and financial impact of failure. The aggregate score shows that a risk is in need of immediate action. An example of a high risk scenario would be one that uses only firmographic data from a single vendor (not tested alternatives). Other examples would be lead scoring models that can only be used with a single vendor and integrated with one CRM without any manual fallback to a documented process.

Building a Risk-Resilient Data Architecture

Redundancy Design

Maintain alternative pathways for every critical data flow. At Packed Data Services, account intelligence is multi-layered by design: firmographic, technographic, and intent signals drawn from multiple feeds, cross-validated before reaching your CRM. If one provider goes offline, your GTM motion continues on the others. Multi-source architectures also improve data quality during normal operations through cross-validation, so the investment pays off before any failure occurs.

Modular Intelligence Layers

Prevent vendor lock-in by separating data acquisition from processing and application. Design lead scoring models that ingest data from multiple sources in standardized formats. Use industry-standard taxonomies for firmographic and technographic classifications. Packed Data Services has built its API-first architecture on this principle: each component is replaceable without disrupting the whole system. When you decouple contact enrichment and scoring from your core CRM, individual components can be updated or replaced without risking system-wide integrity.

Fallback Decision Logic

If primary research is no longer available, well-designed systems will depend on alternative decision-making frameworks instead of shutting down. In the absence of real-time intent signals, lead prioritization will default to past engagement patterns and firmographic fit. When there is no time left to enrich a contact, workflows will rely on the existing CRM data rather than creating a blockage. Sales teams need documented procedures for manual account prioritization when AI scoring is unavailable. Build these capabilities from the start. Retrofitting them after a failure is always more expensive.

Data Architecture Risk is a Strategic Business Decision

Structural data architecture risk accumulates every time you prioritize efficiency over resilience and it compounds until something breaks.

Start your audit now. Map every data dependency. Identify single points of failure. Simulate a provider outage and document what breaks. Score each risk by criticality, fragility, and business impact. Prioritize multi-source strategies for your highest-risk dependencies. Run a chaos test quarterly.

Your data architecture is not infrastructure. It is accumulated risk that will manifest during the next vendor outage, the next acquisition, or the next pricing change. The question is not whether your systems work today. The question is whether they will survive the stresses that are coming.

Analyst reviewing dashboard metrics illustrating B2B data quality dimensions in modern data-driven decision making

Data Quality Dimensions: Beyond the 99% Accuracy Myth

Understanding B2B data quality dimensions is critical to avoiding costly mistakes. Your VP of Sales celebrates: “Our CRM data is 99% accurate!” SDRs prioritize hot leads. Pipeline explodes. Then close rates tank. Why? Perfect names and emails, wrong companies. The 99% accuracy fooled everyone because data quality requires more than precision; it demands relevance, completeness, and context.

Organizations proudly claim their data is “99% accurate.” Yet strategic decisions still fail. Campaigns miss targets. Forecasts drift. Investments underperform. While 64% of organizations rate data quality as their top integrity issue according to Drexel University’s 2025 research, most people focus obsessively on accuracy metrics while ignoring the dimensions that drive business results.

The uncomfortable truth: accuracy on its own does not really guarantee usefulness. The poor data quality is draining U.S. businesses to the tune of $3.1 trillion annually, with one single organization splitting the loss of $12.9 to $15 million per year. Data that is technically correct but without relevance, completeness, or context can still lead to incorrect conclusions.

When Accurate Data Misleads

Teams over-index on accuracy because it is measurable. Accuracy percentages provide a sense of certainty. They signal rigor. They give comfort to stakeholders that their choices are backed by evidence. In the case of a marketing manager or an SDR lead, it is far more straightforward to claim that the database is accurate up to 99% than to justify the reason why the campaign did not bring any pipeline. But this focus creates false comfort. Consider common scenarios:

Sales forecasts built on accurate historical data but ignoring market shifts Customer analytics based on precise engagement metrics but missing intent signals Market sizing calculations derived from exact industry counts but overlooking buying readiness.

In each case, the data is accurate yet strategically misleading. You have a 100% accurate list of Chief Technology Officers at Fortune 500 companies, but if you are selling a product designed for mid-market DevOps teams, that “perfect” data will lead to a 0% conversion rate.

A contact record has a perfectly accurate email address and phone number yet is completely useless if the person left the company six months ago, never had budget authority, or works in an entirely different department than your solution serves. The email validates. The phone connects. The data passes every accurate check. And yet, it produces zero pipeline value.

Precision without relevance produces confidence without clarity.

The Four Critical B2B Data Quality Dimensions

A holistic view of B2B data quality dimensions includes four interconnected elements. At Packed Data, we view data quality not as a single score but as a balanced ecosystem of these critical dimensions.

Accuracy

Accuracy answers a narrow question: Is the data correct? It guarantees that the fields are valid, the figures correspond to reality, and the records are without mistakes. Is the email address valid and accurate? Is the phone number still active? Does the company name accord with the official registration documents?

While accuracy still matters, it plays a foundational role and by itself is not enough. B2B data becomes outdated at a rate of 2.1% monthly on average, so even “accurate” data is nearly a quarter-old if there has been no real-time checking. Analysis of the business contacts data revealed that 70.8% of the contacts were altered in one year.

Relevance

Relevance is concerned with whether the decision at hand requires the data. Highly accurate data about the wrong variables adds noise rather than insight. This involves technographic data, knowing exactly what software a prospect uses, and ideal customer profile analytics.

Knowing a company uses Salesforce is accurate. But is it relevant? If you sell Salesforce implementation services, absolutely. If you sell manufacturing equipment, probably not. Using accurate data that is irrelevant to your sales motion is the fastest way to burn through your marketing budget.

Completeness

Completeness evaluates whether critical information is missing. Incomplete datasets create blind spots that distort analysis. Even highly accurate data loses value when key attributes are absent.

A contact record might have an accurate name and title, but without reporting relationships, decision-making authority, budget responsibility, or current project involvement, you cannot use it to drive qualified conversations. A valid email is accurate, but it is incomplete if you don’t know the company’s recent funding round, their current intent signals, or their existing vendor relationships.

In go-to-market contexts, missing elements such as buying intent, organizational changes, or technology stack shifts significantly alter conclusions about opportunity or risk.

Context

Context is what shapes the way data is interpreted. Metrics only become meaningful when they are set against the larger backdrop: market trends, competitive landscape, organizational strategy, and economic environment.

An organization of 500 people could be a significant mid, market opportunity or a failing business that has just had a huge layoff. The number of employees is correct. Without growth trajectory context, it is strategically meaningless. Contextual data includes buyer intent signals: is the company researching your category right now, or are they browsing general educational content?

Without context, data becomes ambiguous. Acting on accurate data at the wrong time, such as reaching out during leadership restructuring, permanently damages your brand’s reputation.

How Accuracy-Only Thinking Fails

Organizations prioritizing accuracy while ignoring other data quality dimensions encounter predictable failures.

Perfect data answering the wrong question

Teams frequently optimize measurement systems around available data rather than strategic needs. This leads to dashboards that are meticulously accurate yet strategically irrelevant. A SaaS company meticulously validates email deliverability across their prospect database, achieving 99.2% accuracy. Marketing celebrates this metric while campaign response rates languish at 0.8%.

Tracking campaign performance with precision does little if the campaigns target the wrong audience segments. You might accurately identify a prospect is a “VP of Sales.” Without real-time company insights, you miss the fact their company went through a merger, making them a high-churn risk rather than a high-growth prospect.

Missing contextual signals

Many critical signals exist outside internal systems. External signals like market expansion, leadership changes, technological adoption, and competitive activity have a profound influence on results but most of the time they are not tracked. Companies that use only internal metrics may miss the changes that are changing the way customers behave.

An example of Unity Technologies’ Q1 2022 data quality incident shows how reliable data without contextual understanding can lead to unhappy results. The platform had correct numerical data but lacked the contextual intelligence to interpret what those numbers signified. The result? Millions in lost revenue despite technically accurate reporting.

Overconfidence in narrow datasets

Accurate data creates overconfidence when derived from limited sources. Single-source datasets may lack diversity of perspective, increasing the risk of biased conclusions. Organizations measure what’s easy to validate like email syntax, phone format, and company name spelling, and extrapolate that precision across unmeasured dimensions.

Your database might achieve 95% accuracy at the moment of capture yet become 70% obsolete within a year through natural business dynamics no validation check catches. The most valuable data dimensions, budget authority, active projects, technology adoption stage, and competitive evaluation timeline, change continuously and resist easy validation.

Designing Holistic B2B Data Quality Models: All Dimensions Matter

To overcome the accuracy fallacy, organizations must redesign data strategies around business questions rather than technical metrics.

Business-question-first design

Start with decisions, not datasets. Key questions should guide data collection: What strategic choice must be made? What signals indicate success or risk? What information gaps could mislead us?

Rather than collecting accurate data and hoping it proves useful, define business outcomes first. Identify accounts most likely to convert within 90 days, for instance. Then assemble the specific data dimensions that predict those outcomes: buying signals, technology fit, budget timing, and decision-maker engagement.

At Packed Data, we help organizations bypass the accuracy fallacy by layering buyer intent signals and real-time company insights. This approach ensures data relevance from the outset.

Context enrichment

Raw data is more valuable when additional dimensions are added to it. Some of the dimensions would be firmographic and technographic attributes, behavior and intent indicators, organizational change signals, and industry, specific benchmarks.

Data points by themselves are like pieces of a puzzle. When you put the puzzle together, you can see the picture. So do not be satisfied with the name and position of a person. Take advantage of the Packed Data platform, for example, to find out the intent signals that indicate when a prospect is beginning a buying cycle. It is quite a strategic move to figure out the growth trajectory, technology adoption gaps, and hiring trends of a company after knowing that the company has just raised Series B funding.

Multi-source validation

Combining multiple independent sources not only increases reliability but also the completeness of the information. When datasets are used for validation purposes, they can reveal differences, help in reducing bias and also increase the certainty of the conclusions.

One way to do this is by cross, referencing firmographics from several providers, confirming intent signals with engagement data from first-party, and continuously updating the records. The tactic reflects the way high, performing revenue teams combine CRM data, intent signals, and market intelligence to create a comprehensive view of their opportunities.

By 2026, the ‘Single Source of Truth’ is generally considered to be a myth. The strongest companies nowadays rely on multi-source validation, they do this by cross-referencing account intelligence with real, time platform insights so as to check for any discrepancies in their data which otherwise would have been a static snapshot from six months ago.

Business Impact of Holistic B2B Data Quality Dimensions

Moving beyond accuracy to embrace all B2B data quality dimensions delivers tangible strategic benefits.

Better strategic alignment

Relevant and contextualized data brings the teams together around common realities instead of each one working with isolated metrics. Marketing, sales, and leadership function from the same joint understanding of market conditions and priorities. Sales departments reveal that if they are provided with deep background intelligence instead of only having contact data that is accurate, they will be able to give more specific information to the prospects relating to their current issues, competitive positioning, and the right time for technology adoption.

Fewer wasted initiatives

Many failed initiatives stem from misinterpreting data rather than lacking effort. Holistic data quality reduces false starts by ensuring decisions reflect real conditions rather than partial views. Sales teams waste 27.3% of their time pursuing bad leads. Organizations implementing holistic quality models dramatically reduce wasted effort through AI-driven lead prioritization evaluating prospects across multiple quality dimensions.

Higher ROI from data investments

As businesses invest huge sums in analytics tools, the returns are often very disappointing. The problem is not with the technology but how the data is presented and understood. When data quality models go beyond accuracy to include relevance and context, the derived insights become actionable, resulting in improved outcomes across functions.

Research shows organizations using AI for data quality improvements report 30% accuracy enhancements within the first year, but more importantly, they see 20% better campaign response rates, 15% higher close rates, and 12% increased conversion rates.

From Precision to Intelligence: Mastering B2B Data Quality Dimensions

The modern competitive landscape rewards organizations that master all B2B data quality dimensions, not just accuracy.

Organizations spending more than $420 billion annually on big data and analytics still find that only 38% of CEOs report having the right insights to achieve their commercial goals. If the data is “accurate, ” then why are 86% of B2B purchases still stalling?

Leaders should consider not just asking “Is this data correct?” but also “Is this the right data, in the right context, for the right decision?” At Packed Data, we view account intelligence and contact enrichment through the lens that a correct email is only the start. Adding buyer intent signals and real-time company insights, we guide you to focus on data that really changes things.

Companies that accept this expanded view stop merely measuring reality and start comprehending it. Accuracy is the floor, not the ceiling. In a world where 81% of buyers initiate first contact with sellers, your data cannot be “correct” alone. It must be insightful. For a revenue leader, the only metric that matters is actionability.