Tag Archives: B2B data enrichment

Professional analyzing unstable data dashboards highlighting the data observability gap in monitoring data systems

The Data Observability Gap: Why Teams Don’t Know When Their Data Is Breaking

Dashboards are green, pipelines are working, and alerts are silent. But at the same time, you’re spending valuable time chasing down non-existent accounts, your SDRs’ days are wasted reaching out to bad leads, and your forecast accuracy rate has gone down by 41%. This is a case of invisible data corruption. It happens quietly and costs businesses an estimated $12.9 million per year. Data corruption is one of the main reasons why almost 42% of enterprises stated that more than half of their AI initiatives were postponed or failed, according to a survey conducted in 2025 among 401 data leaders.

Most organizations monitor infrastructure religiously. They track CPU usage, memory consumption, and API response times. But they do not monitor their data, the actual asset driving decisions. This is the data observability gap, and for revenue operations teams managing seven and eight-figure pipelines, it represents an invisible tax on every strategic choice.

What Data Observability Measures (And Why the Gap Exists)

Data observability extends beyond traditional system monitoring. It answers not “Is the system running?” but “Is the system producing reliable outputs?”

The distinction matters. A CRM sync might complete successfully while dropping 15% of contact updates. An enrichment job processes on schedule but only covers 60% of records due to API limits. Intent signals arrive with 72-hour delays. No errors trigger. No alerts fire. The damage compounds silently.

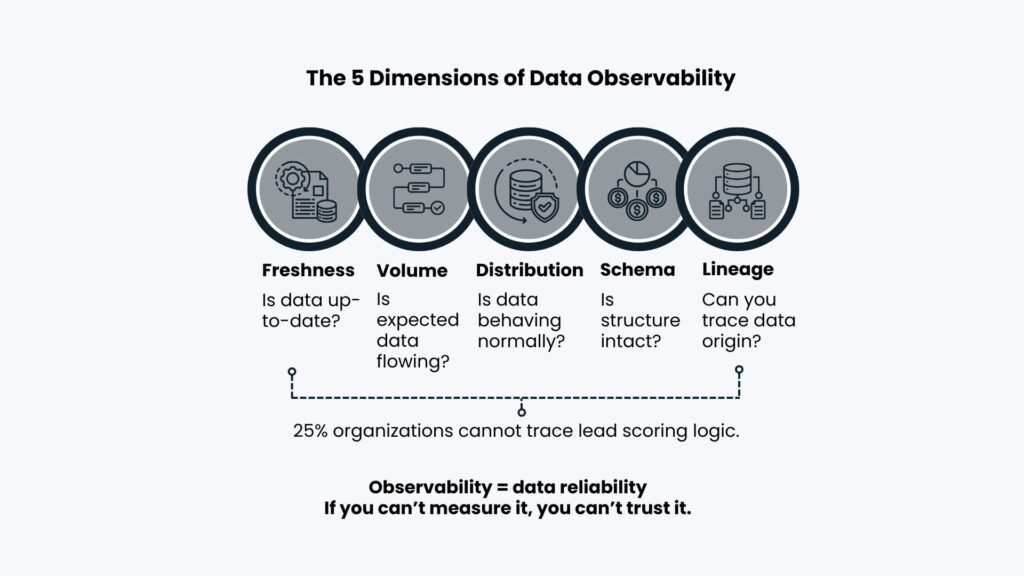
The Five Critical Dimensions of Data Observability Gap

Freshness measures how recent data is and whether updates arrive on time. In B2B, an intent signal loses value rapidly. If latency jumps from 5 minutes to 5 hours, the data has failed even if the pipeline succeeded.

Volume tracks whether expected amounts of data flow through systems. A sudden spike or flatline typically indicates broken tracking pixels or failed API integrations. A daily enrichment job that processes 40% fewer records than baseline has failed, regardless of technical completion status.

Distribution catches problems that do not violate rules but distort reality. If 35% of your pipeline typically comes from enterprise accounts and suddenly shifts to 55%, you face either a market breakthrough or a segmentation failure. When email open rates jump 40% overnight, you probably have a tracking implementation break, not an engagement miracle.

Schema monitors structural integrity. When the “Industry” field starts receiving job titles, your schema has drifted. When a data provider shifts existing values from a “size” field to “legacy_size” without notification, your segmentation rules execute against empty fields. No errors appear. Your ICP targeting just stops working.

Lineage provides the audit trail from source to dashboard. When conversion rates look wrong, lineage allows you to trace back through transformations to find exactly where logic failed. According to SiriusDecisions research, 25% of B2B organizations cannot trace how their lead scores are calculated, making silent failures nearly impossible to diagnose.

Four Data Observability Failures Hiding in Revenue Pipelines

Revenue teams operate with broken data longer than they realize because observability gaps manifest in ways that evade standard monitoring. Each of the following failure modes is a direct symptom of the data observability gap.

Silent schema drift occurs when upstream systems change structures without notification. A data provider modifies their taxonomy, now categorizing directors as “management” instead of “leadership.” Your lead scoring model continues executing perfectly. Results become meaningless. Detection happens quarters later when reviewing win rates by segment.

Gradual decay masquerading as variance presents as normal fluctuation. Email bounce rates creep from 3% to 11% over eight months. Each week feels within range. No single day trips an alert. But the cumulative impact; thousands of unreachable prospects, declining sender reputation, contaminated lists, represents material revenue leakage with no definitive break moment.

Transformation logic failures emerge when business rules and data reality diverge. Marketing automation shows 450 MQLs this quarter. CRM reports 520. Your data warehouse calculates 475. Each system is internally consistent. Each team defends their number. Revenue forecasts built on any of them are equally wrong, but no error appears in any log.

Cross-system inconsistency creates multiple versions of truth. One enterprise SaaS company discovered their entire Q3 demand generation budget targeted accounts using an enrichment feed that had not updated industry classifications in 14 months. Their “high-growth fintech” segment was actually legacy financial services companies that had since pivoted or been acquired.

The Revenue Cost of the Data Observability Gap

The business cost of the data observability gap concentrates in three areas.

Pipeline inefficiency manifests when teams operate on degraded data. If 20% of contact information is outdated and systems cannot flag which 20%, reps either waste time on dead ends or spend resources re-verifying everything. Salesforce’s 2023 State of Sales report found that reps spend 72% of their week on non-selling activities, with data quality issues consuming the largest share. For a 50-person sales team, a 10% reduction in selling time from bad data represents roughly $2.1 million in lost productivity annually.

Misallocated GTM spend occurs when targeting relies on corrupted signals. Intent data with 48-hour latency gets treated as real-time, causing marketing to engage prospects after buying windows close. Firmographic data with 35% accuracy drives ABM campaigns to wrong personas.

Delayed problem detection compounds every other failure. The leader of revenue operations in a Series C firm found that they were using inaccurate information to make important business decisions due to an error in their pipeline reports, which had been going on for five months without the team’s knowledge. Deals that got synced from Salesforce to the warehouse were somehow getting filtered out of the report depending on where they stood in the pipeline process.

How to Close the Data Observability Gap: 5 Operational Steps

Implementation requires structured measurement across the data lifecycle.

Define data health metrics explicitly. Do not rely on implicit assumptions. Set tolerable fill rates, freshness levels, and accuracy standards for mission-critical resources. A contact record fit for newsletter segmentation might not suffice for sales campaigns. Measure data quality on factors that count: completeness of the fields needed for engagement, freshness of enrichments (job title updated within 90 days), credibility of signals (intent scores with proven accuracy >70%).

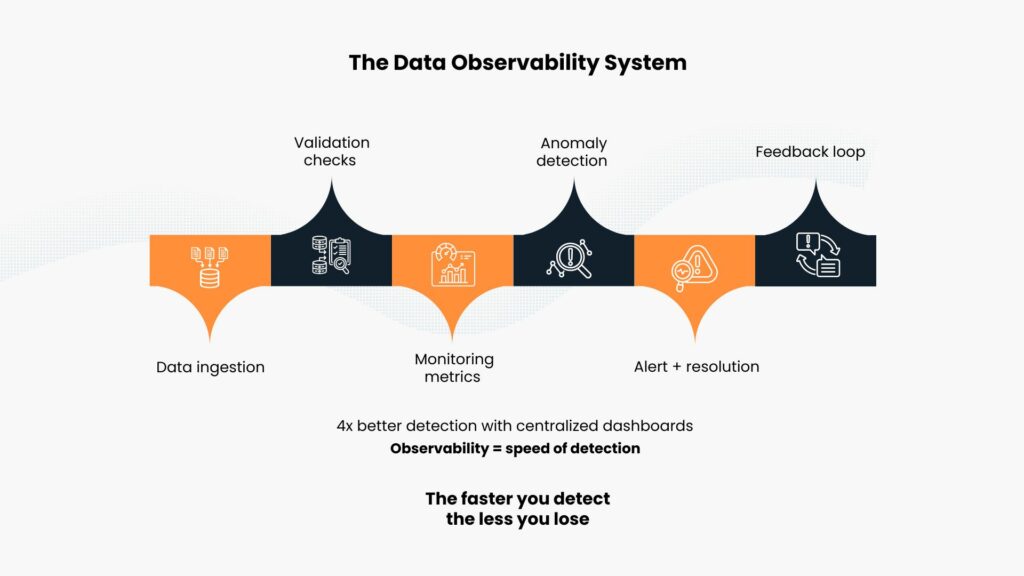
Implement automated anomaly detection. Track expected distributions and trigger alerts when patterns shift. If firmographic coverage typically holds at 90% and drops to 65%, high-value accounts are being excluded from campaigns. Manual checks do not scale. Deploy statistical or machine learning-based detection for volume, freshness, and distribution anomalies.

Create centralized visibility dashboards. These are not engineering dashboards showing server metrics. Such metrics include:

“Freshness of contact information for Q1 target customers: 78% refreshed within 30 days” or
“Latency of intent signal: Median 8 hours, 95th percentile 26 hours.”

Firms having unified dashboards measuring data health have a fourfold higher ability to detect problems than those that depend on reactive reports from users.

Assign clear ownership with defined protocols. Revenue operations typically owns CRM data integrity, sales owns account and opportunity data, marketing owns campaign and engagement data. Each owner needs authority to reject bad data. When anomaly detection flags a 25% drop in daily contact imports, documented protocols should specify who gets alerted, investigation SLAs, and rollback procedures.

Integrate observability into workflows. Before campaigns launch, reporting, and before scaling, validate data readiness, data integrity and data reliability respectively. Track mean time to detection (MTTD) and mean time to resolution (MTTR) for data incidents. Improving these metrics is the goal of observability.

The foundation of revenue growth strategy is having a unified RevOps data infrastructure.

Why Closing the Data Observability Gap Is a Strategic Advantage

The data observability gap is not about systems going down, it is about broken data continuing to drive decisions undetected.

Fixing pipeline inefficiency is impossible if you can’t see that 30% of contact data is stale. Optimizing conversion is impossible when you don’t even know your lead scoring broke six weeks ago. And if you can’t quantify the revenue impact of current failures, you’ll never justify data quality investments.

For revenue leaders, the observability gap represents a fundamental strategic vulnerability: flying blind while believing you can see. Based on industry standards, data problems may affect between 20-30% of all operational data pipelines at any given moment, yet without causing any failure points. These problems go unnoticed for a long time, which means that decisions are being made based on inaccurate data.

Data maturity’s next step is not about having more data, using more tools, or creating additional dashboards. The focus should be on improving data visibility. Because targeting depends on accurate data, prioritization depends on timely data, and conversion depends on relevant data.

Organizations implementing comprehensive observability see measurable improvements. Full-stack observability reduces outage costs by 37% and mean time to recovery by 50%. Research shows 51% of organizations report achieving a 2-3x ROI on their observability spend.

Closing the data observability gap is the next step in data maturity and the most underdiscussed competitive advantage in modern GTM.

Analyst reviewing dashboard metrics illustrating B2B data quality dimensions in modern data-driven decision making

Data Quality Dimensions: Beyond the 99% Accuracy Myth

Understanding B2B data quality dimensions is critical to avoiding costly mistakes. Your VP of Sales celebrates: “Our CRM data is 99% accurate!” SDRs prioritize hot leads. Pipeline explodes. Then close rates tank. Why? Perfect names and emails, wrong companies. The 99% accuracy fooled everyone because data quality requires more than precision; it demands relevance, completeness, and context.

Organizations proudly claim their data is “99% accurate.” Yet strategic decisions still fail. Campaigns miss targets. Forecasts drift. Investments underperform. While 64% of organizations rate data quality as their top integrity issue according to Drexel University’s 2025 research, most people focus obsessively on accuracy metrics while ignoring the dimensions that drive business results.

The uncomfortable truth: accuracy on its own does not really guarantee usefulness. The poor data quality is draining U.S. businesses to the tune of $3.1 trillion annually, with one single organization splitting the loss of $12.9 to $15 million per year. Data that is technically correct but without relevance, completeness, or context can still lead to incorrect conclusions.

When Accurate Data Misleads

Teams over-index on accuracy because it is measurable. Accuracy percentages provide a sense of certainty. They signal rigor. They give comfort to stakeholders that their choices are backed by evidence. In the case of a marketing manager or an SDR lead, it is far more straightforward to claim that the database is accurate up to 99% than to justify the reason why the campaign did not bring any pipeline. But this focus creates false comfort. Consider common scenarios:

Sales forecasts built on accurate historical data but ignoring market shifts Customer analytics based on precise engagement metrics but missing intent signals Market sizing calculations derived from exact industry counts but overlooking buying readiness.

In each case, the data is accurate yet strategically misleading. You have a 100% accurate list of Chief Technology Officers at Fortune 500 companies, but if you are selling a product designed for mid-market DevOps teams, that “perfect” data will lead to a 0% conversion rate.

A contact record has a perfectly accurate email address and phone number yet is completely useless if the person left the company six months ago, never had budget authority, or works in an entirely different department than your solution serves. The email validates. The phone connects. The data passes every accurate check. And yet, it produces zero pipeline value.

Precision without relevance produces confidence without clarity.

The Four Critical B2B Data Quality Dimensions

A holistic view of B2B data quality dimensions includes four interconnected elements. At Packed Data, we view data quality not as a single score but as a balanced ecosystem of these critical dimensions.

Accuracy

Accuracy answers a narrow question: Is the data correct? It guarantees that the fields are valid, the figures correspond to reality, and the records are without mistakes. Is the email address valid and accurate? Is the phone number still active? Does the company name accord with the official registration documents?

While accuracy still matters, it plays a foundational role and by itself is not enough. B2B data becomes outdated at a rate of 2.1% monthly on average, so even “accurate” data is nearly a quarter-old if there has been no real-time checking. Analysis of the business contacts data revealed that 70.8% of the contacts were altered in one year.

Relevance

Relevance is concerned with whether the decision at hand requires the data. Highly accurate data about the wrong variables adds noise rather than insight. This involves technographic data, knowing exactly what software a prospect uses, and ideal customer profile analytics.

Knowing a company uses Salesforce is accurate. But is it relevant? If you sell Salesforce implementation services, absolutely. If you sell manufacturing equipment, probably not. Using accurate data that is irrelevant to your sales motion is the fastest way to burn through your marketing budget.

Completeness

Completeness evaluates whether critical information is missing. Incomplete datasets create blind spots that distort analysis. Even highly accurate data loses value when key attributes are absent.

A contact record might have an accurate name and title, but without reporting relationships, decision-making authority, budget responsibility, or current project involvement, you cannot use it to drive qualified conversations. A valid email is accurate, but it is incomplete if you don’t know the company’s recent funding round, their current intent signals, or their existing vendor relationships.

In go-to-market contexts, missing elements such as buying intent, organizational changes, or technology stack shifts significantly alter conclusions about opportunity or risk.

Context

Context is what shapes the way data is interpreted. Metrics only become meaningful when they are set against the larger backdrop: market trends, competitive landscape, organizational strategy, and economic environment.

An organization of 500 people could be a significant mid, market opportunity or a failing business that has just had a huge layoff. The number of employees is correct. Without growth trajectory context, it is strategically meaningless. Contextual data includes buyer intent signals: is the company researching your category right now, or are they browsing general educational content?

Without context, data becomes ambiguous. Acting on accurate data at the wrong time, such as reaching out during leadership restructuring, permanently damages your brand’s reputation.

How Accuracy-Only Thinking Fails

Organizations prioritizing accuracy while ignoring other data quality dimensions encounter predictable failures.

Perfect data answering the wrong question

Teams frequently optimize measurement systems around available data rather than strategic needs. This leads to dashboards that are meticulously accurate yet strategically irrelevant. A SaaS company meticulously validates email deliverability across their prospect database, achieving 99.2% accuracy. Marketing celebrates this metric while campaign response rates languish at 0.8%.

Tracking campaign performance with precision does little if the campaigns target the wrong audience segments. You might accurately identify a prospect is a “VP of Sales.” Without real-time company insights, you miss the fact their company went through a merger, making them a high-churn risk rather than a high-growth prospect.

Missing contextual signals

Many critical signals exist outside internal systems. External signals like market expansion, leadership changes, technological adoption, and competitive activity have a profound influence on results but most of the time they are not tracked. Companies that use only internal metrics may miss the changes that are changing the way customers behave.

An example of Unity Technologies’ Q1 2022 data quality incident shows how reliable data without contextual understanding can lead to unhappy results. The platform had correct numerical data but lacked the contextual intelligence to interpret what those numbers signified. The result? Millions in lost revenue despite technically accurate reporting.

Overconfidence in narrow datasets

Accurate data creates overconfidence when derived from limited sources. Single-source datasets may lack diversity of perspective, increasing the risk of biased conclusions. Organizations measure what’s easy to validate like email syntax, phone format, and company name spelling, and extrapolate that precision across unmeasured dimensions.

Your database might achieve 95% accuracy at the moment of capture yet become 70% obsolete within a year through natural business dynamics no validation check catches. The most valuable data dimensions, budget authority, active projects, technology adoption stage, and competitive evaluation timeline, change continuously and resist easy validation.

Designing Holistic B2B Data Quality Models: All Dimensions Matter

To overcome the accuracy fallacy, organizations must redesign data strategies around business questions rather than technical metrics.

Business-question-first design

Start with decisions, not datasets. Key questions should guide data collection: What strategic choice must be made? What signals indicate success or risk? What information gaps could mislead us?

Rather than collecting accurate data and hoping it proves useful, define business outcomes first. Identify accounts most likely to convert within 90 days, for instance. Then assemble the specific data dimensions that predict those outcomes: buying signals, technology fit, budget timing, and decision-maker engagement.

At Packed Data, we help organizations bypass the accuracy fallacy by layering buyer intent signals and real-time company insights. This approach ensures data relevance from the outset.

Context enrichment

Raw data is more valuable when additional dimensions are added to it. Some of the dimensions would be firmographic and technographic attributes, behavior and intent indicators, organizational change signals, and industry, specific benchmarks.

Data points by themselves are like pieces of a puzzle. When you put the puzzle together, you can see the picture. So do not be satisfied with the name and position of a person. Take advantage of the Packed Data platform, for example, to find out the intent signals that indicate when a prospect is beginning a buying cycle. It is quite a strategic move to figure out the growth trajectory, technology adoption gaps, and hiring trends of a company after knowing that the company has just raised Series B funding.

Multi-source validation

Combining multiple independent sources not only increases reliability but also the completeness of the information. When datasets are used for validation purposes, they can reveal differences, help in reducing bias and also increase the certainty of the conclusions.

One way to do this is by cross, referencing firmographics from several providers, confirming intent signals with engagement data from first-party, and continuously updating the records. The tactic reflects the way high, performing revenue teams combine CRM data, intent signals, and market intelligence to create a comprehensive view of their opportunities.

By 2026, the ‘Single Source of Truth’ is generally considered to be a myth. The strongest companies nowadays rely on multi-source validation, they do this by cross-referencing account intelligence with real, time platform insights so as to check for any discrepancies in their data which otherwise would have been a static snapshot from six months ago.

Business Impact of Holistic B2B Data Quality Dimensions

Moving beyond accuracy to embrace all B2B data quality dimensions delivers tangible strategic benefits.

Better strategic alignment

Relevant and contextualized data brings the teams together around common realities instead of each one working with isolated metrics. Marketing, sales, and leadership function from the same joint understanding of market conditions and priorities. Sales departments reveal that if they are provided with deep background intelligence instead of only having contact data that is accurate, they will be able to give more specific information to the prospects relating to their current issues, competitive positioning, and the right time for technology adoption.

Fewer wasted initiatives

Many failed initiatives stem from misinterpreting data rather than lacking effort. Holistic data quality reduces false starts by ensuring decisions reflect real conditions rather than partial views. Sales teams waste 27.3% of their time pursuing bad leads. Organizations implementing holistic quality models dramatically reduce wasted effort through AI-driven lead prioritization evaluating prospects across multiple quality dimensions.

Higher ROI from data investments

As businesses invest huge sums in analytics tools, the returns are often very disappointing. The problem is not with the technology but how the data is presented and understood. When data quality models go beyond accuracy to include relevance and context, the derived insights become actionable, resulting in improved outcomes across functions.

Research shows organizations using AI for data quality improvements report 30% accuracy enhancements within the first year, but more importantly, they see 20% better campaign response rates, 15% higher close rates, and 12% increased conversion rates.

From Precision to Intelligence: Mastering B2B Data Quality Dimensions

The modern competitive landscape rewards organizations that master all B2B data quality dimensions, not just accuracy.

Organizations spending more than $420 billion annually on big data and analytics still find that only 38% of CEOs report having the right insights to achieve their commercial goals. If the data is “accurate, ” then why are 86% of B2B purchases still stalling?

Leaders should consider not just asking “Is this data correct?” but also “Is this the right data, in the right context, for the right decision?” At Packed Data, we view account intelligence and contact enrichment through the lens that a correct email is only the start. Adding buyer intent signals and real-time company insights, we guide you to focus on data that really changes things.

Companies that accept this expanded view stop merely measuring reality and start comprehending it. Accuracy is the floor, not the ceiling. In a world where 81% of buyers initiate first contact with sellers, your data cannot be “correct” alone. It must be insightful. For a revenue leader, the only metric that matters is actionability.