Tag Archives: data quality management

Professional reviewing and approving digital records as part of a data trust architecture for reliable business decision-making

Data Trust Architecture: Why Reliable Data Matters More Than More Data

When the VP of Sales questions the pipeline forecast three hours before the board meeting, the problem isn’t data scarcity; it’s data credibility. This is the core challenge that data trust architecture is designed to solve. Modern B2B organizations run CRMs, enrichment platforms, intent providers, attribution tools, and AI-driven scoring engines in parallel. Yet a 2025 survey of 72 revenue-focused companies found that 68% of executives and 59% of RevOps leaders regularly questioned the accuracy of their core dashboards. That is not a volume problem. That is a data trust collapse.

According to OneStream, 72% of companies say bad data costs them at least $500,000, and more than one-third report losses over $1 million. A mid-market B2B firm, with $50 million in yearly income, actually loses around $1.25 million each quarter for every week their strategic decisions are held up because of data issues. The future competitive advantage in B2B intelligence belongs to organizations with the most trusted data systems, not the largest ones.

Why Data Trust Breaks in Revenue Organizations

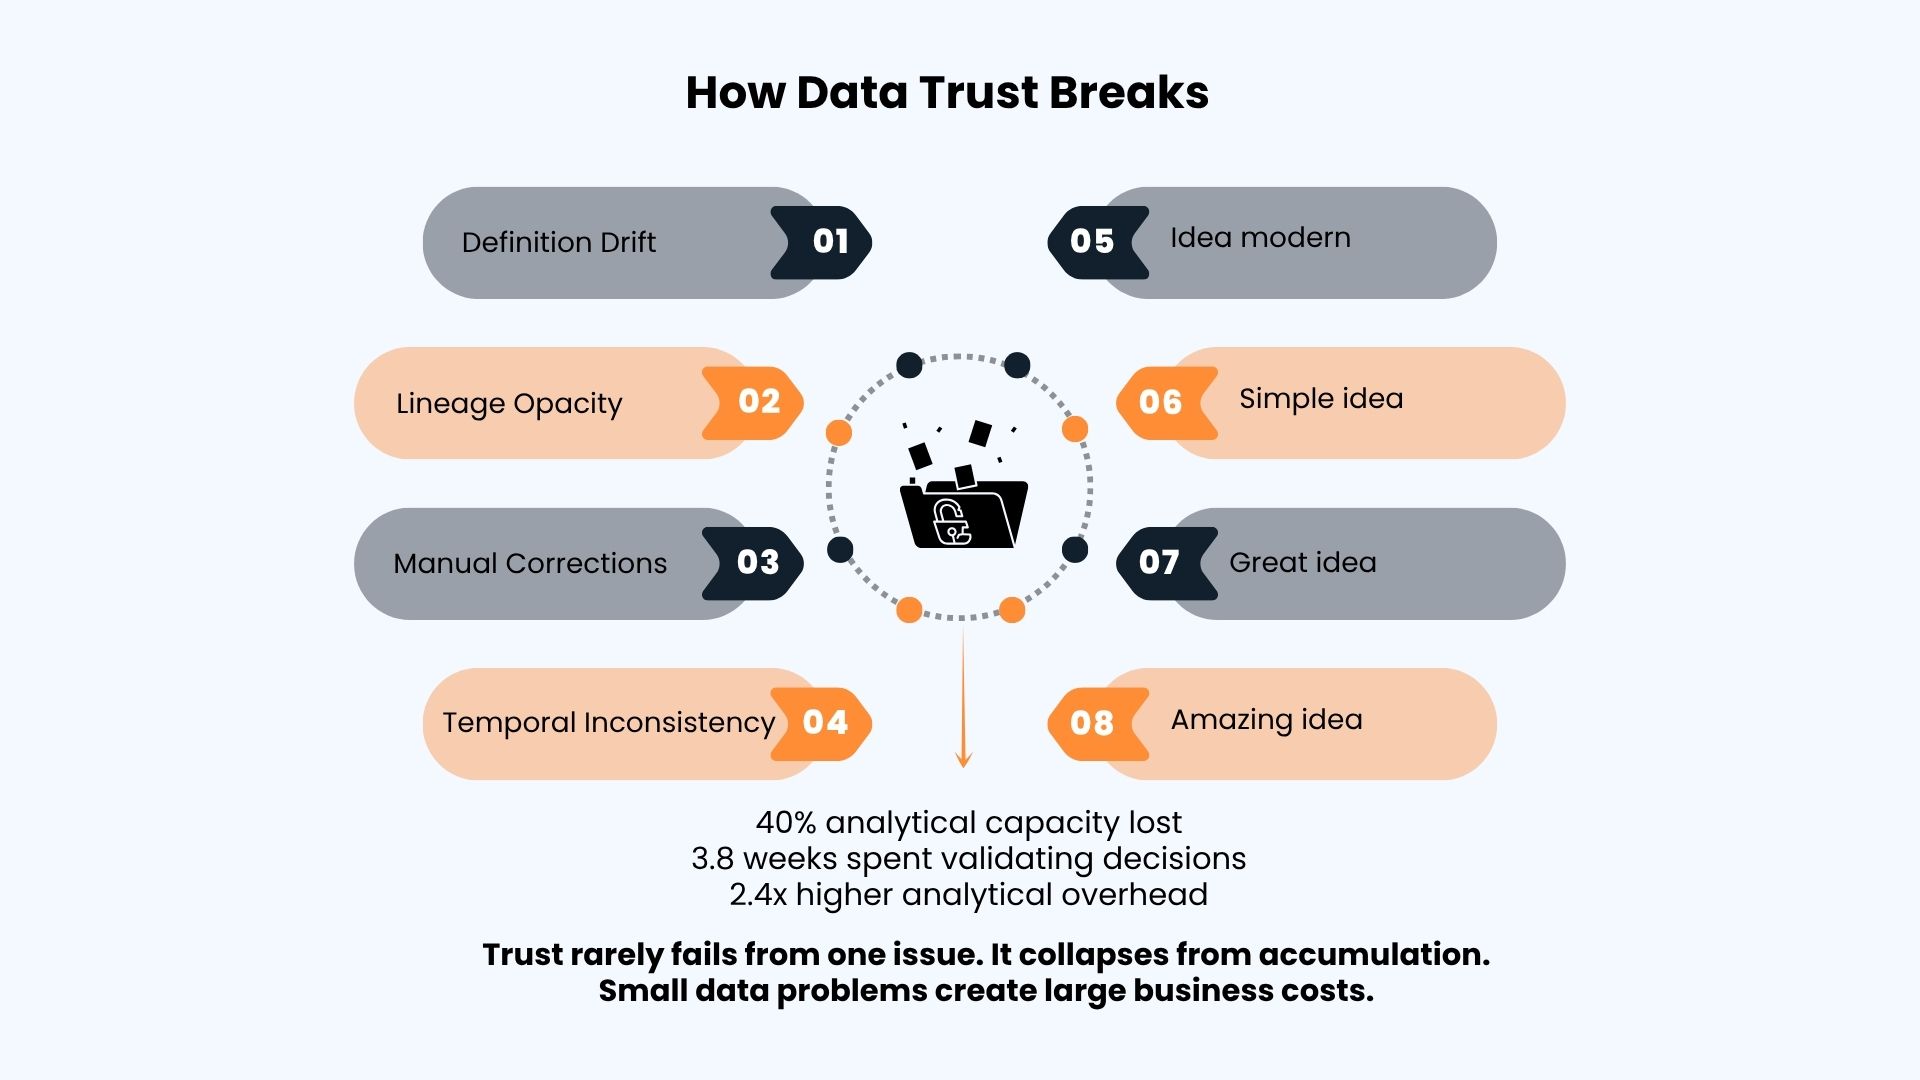
Data trust rarely collapses from a single failure. It erodes through four compounding structural problems.

Definition Drift and Lineage Opacity

Definition drift is the most common fracture point. Marketing counts an “active account” using website intent signals. Sales counts it only after a validated opportunity exists in the pipeline. Finance recognizes it after the first invoice clears. A 2024 analysis of 200 B2B organizations found an average of 4.7 conflicting definitions for core metrics across departments. One SaaS company discovered a 23% discrepancy between marketing and sales pipeline numbers that stalled a market expansion decision for six weeks. RevOps teams in low-definition environments waste an estimated 40% of their analytical capacity reconciling conflicts rather than generating actionable insight.

Lineage opacity compounds the damage. Modern B2B data architectures pass through 7 to 12 transformation layers between source systems and executive dashboards. A 2025 RevOps survey found that only 19% of teams could reliably trace 90% of core revenue metrics back to their source. A telecommunications B2B provider traced an 18% variance in customer lifetime value calculations through five transformation layers to a JOIN operation excluding multi-product customers. The error had misdirected $4.2 million in R&D resources over eight months. Without lineage, debugging is archaeology.

Manual Corrections and Temporal Inconsistency

Undocumented manual corrections are equally destructive. In 68% of B2B organizations studied, finance teams make manual adjustments to revenue data that are never logged in audit-accessible formats. One manufacturing company’s monthly reporting incorporated 127 undocumented Excel adjustments maintained by three analysts. When two departed within six weeks, month-end close extended from four days to nineteen days while the team reverse-engineered the correction logic.

Temporal inconsistency in snapshot data creates a subtler but equally costly problem. When March pipeline forecasts use February 15 data but the comparison baseline uses February 28 data, the 13-day delta introduces noise that masquerades as signal. A private equity firm discovered their month-over-month growth calculations compared snapshots across different billing cycles, causing three portfolio companies to be systematically underfunded.

The Compounding Revenue Cost of Low Data Trust

Low data trust does not just slow decisions. It restructures how organizations operate, creating cascading costs that function as a hidden tax on the entire revenue pipeline.

Analytical duplication alone is substantial. A 2024 RevOps case study found an organization spending 11,000 analyst hours per year reconciling data that should have been settled once. Organizations with low data trust spend 2.4 times more on analytical headcount relative to revenue than high-trust peers.

Tool adoption collapses in low-trust environments. Enterprise analytics implementations average $2.8 million in first-year costs. When users continue relying on legacy spreadsheets, adoption stalls near 40%, tripling the effective cost per active user. A 2025 benchmark of 50 revenue teams found that 63% of SDRs and AEs used spreadsheets as their primary source for account prioritization, not the company-wide BI system.

The speed penalty is measurable. The median B2B company takes 6.2 weeks to agree on big decisions, and it spends 3.8 weeks just verifying data. Companies with low trust in their data take 31% longer to wrap up their plans. On the flip side, rivals who trust their data cut their decision-making time by 60%, gaining first-mover benefits that stack up in every cycle.

The LIVE Framework: Four Pillars of Data Trust Architecture

Building a reliable data trust architecture requires four foundational capabilities that work together.

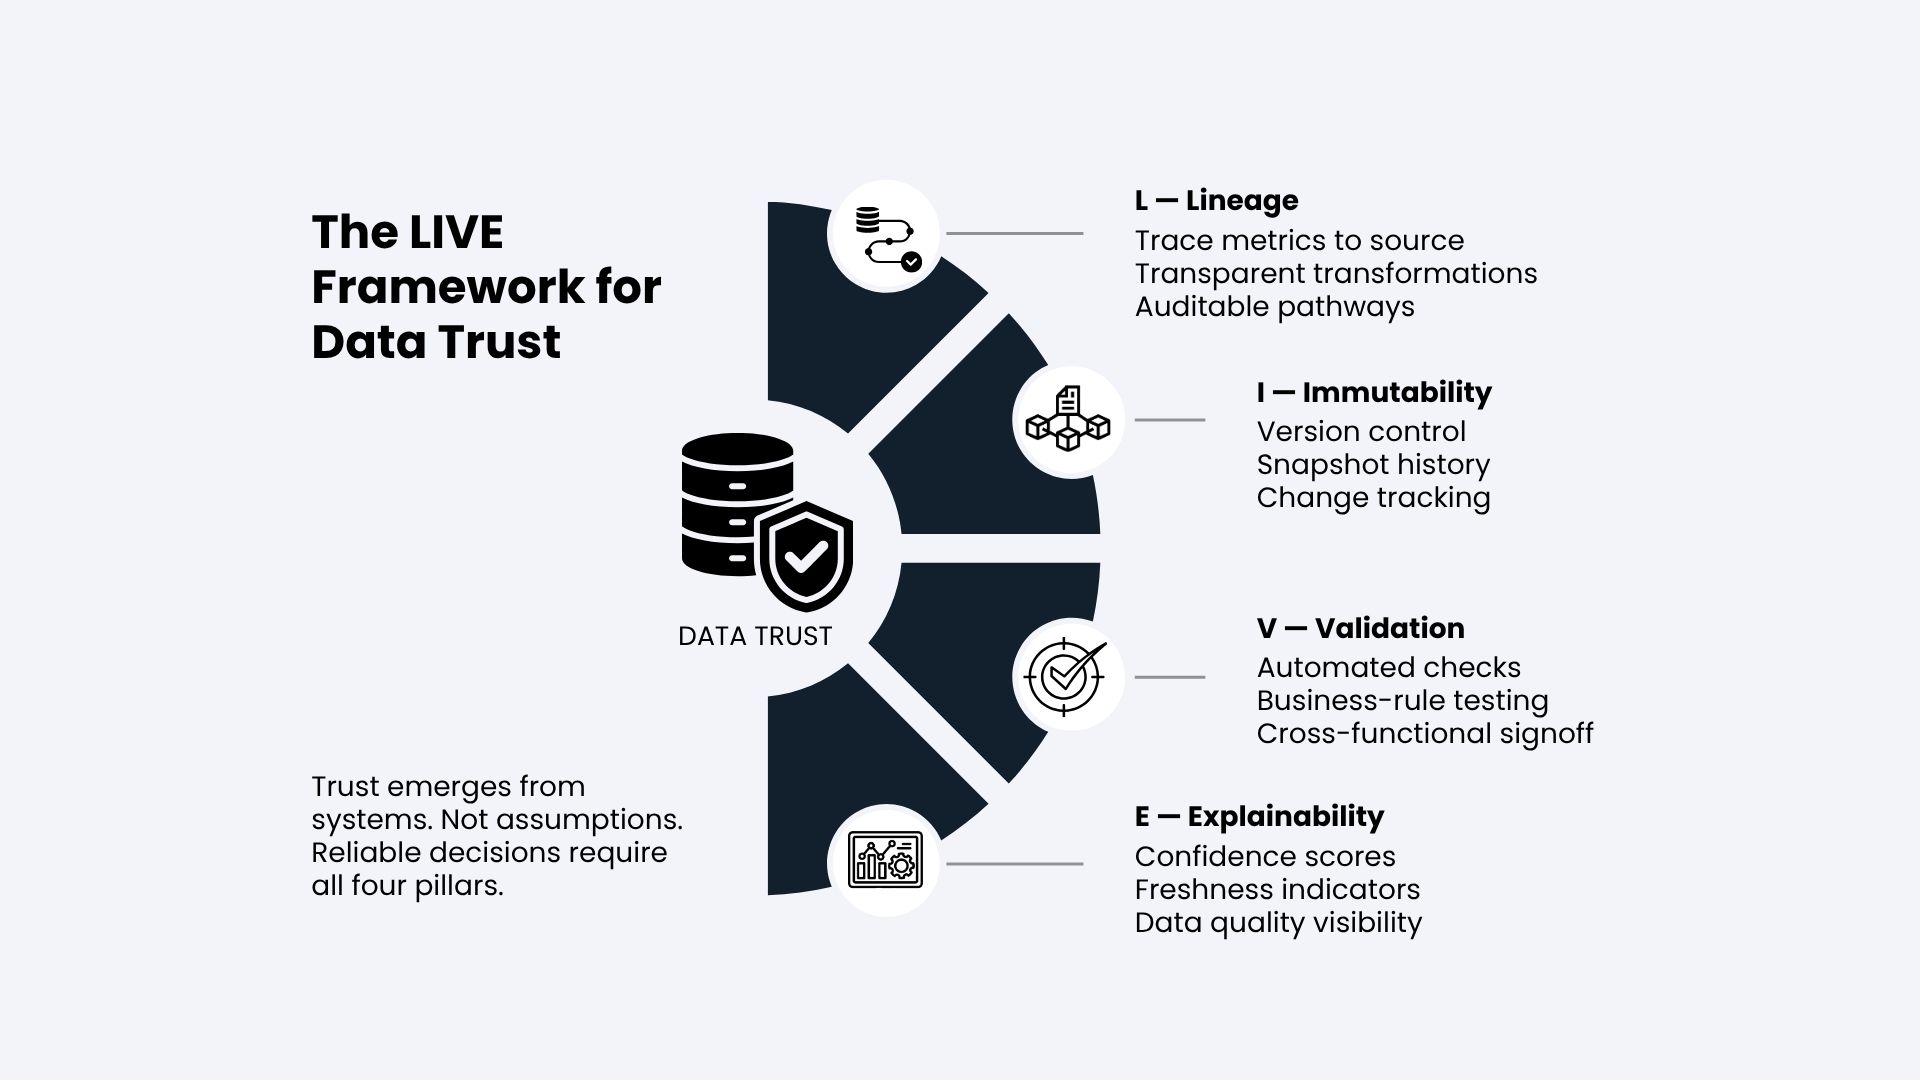
Lineage means every metric traces back to its source through documented, auditable pathways visible to business stakeholders, not just data engineers. Column-level lineage implementation at one enterprise software company reduced analyst time spent on “where does this number come from” investigations by 73%.

Making datasets immutable is about treating them like code. This means versioning each transformation, taking snapshots at key decision points, and keeping logs of changes and reasons why those changes happened. Take a B2B logistics firm; after they started versioning their datasets, they reduced their monthly discrepancy solving time from 40 hours to just 7 hours. That’s huge!

For validation, you need checks across different levels. Start with checksums in the source system to make sure the data warehouse is accurate. Add automated business rule tests for logic checks before report publishing. Also, include cross-departmental approval steps where finance and sales teams must sign off on figures together. At a manufacturing company, a similar setup caught a currency conversion mistake in cost calculations that had gone unnoticed for 14 long months. With the new validation process, they spotted it right on day one.

Explainability means showing confidence levels right in dashboards. Including data freshness, completeness scores, and source quality ratings gives stakeholders the context needed to properly interpret the metrics. One SaaS company added confidence scoring and saw executive engagement with analytics dashboards rise 45%, as leaders got more visibility into data limitations.

You can read more about building a composable data architecture here.

A Practical Evaluation Tool: The Data Trust Scorecard

A practical way to audit your data trust architecture is the RevOps Scorecard. RevOps leaders can use a Data Trust Scorecard to measure trust in core revenue metrics. This scorecard rates each metric on four things from 0 to 5.

First, Lineage Transparency: Can we trace the metric to its origin?

Second, Governance and Process: Does paperwork exist for changes and have people been told about them?

Third, Definition Clarity: Has everyone agreed to one definition?

Fourth, Adoption and Reliance: Do stakeholders make calls based on the metric or do they secretly use other spreadsheets?

The Trust Score is the average of those four parts. When used in a 2025 RevOps study, it cut data-checking delays by 28% and boosted analytics adoption by 19%, all within a year and a half.

Practical Recommendations for RevOps Leaders

Audit trust failures directly. Map where stakeholders distrust systems, which dashboards face the most scrutiny, and where manual verification recurs. Trust friction reveals the weak points that accuracy metrics alone cannot surface.

Create a shared metric glossary for the most crucial GTM metrics. Include the definition, source system, key rules, owner, and change history for each one. Show this to everyone, and make it a requirement to review it before getting access to the executive dashboard.

Build cross-functional data governance. Form a working group with representatives from RevOps, sales operations, marketing operations, and finance. Define change-control processes and require that all substantive changes are communicated before they affect operational reporting. Organizations with complete alignment between finance and IT are 5.5 times more likely to report full confidence in their data.

Monitor continuously. Set service-level indicators for key revenue metrics, automate freshness and anomaly checks, and treat data quality like application performance. Catching structural errors in real time prevents downstream sales impact before it registers in the pipeline.

Reliable Data Is the Actual Competitive Advantage

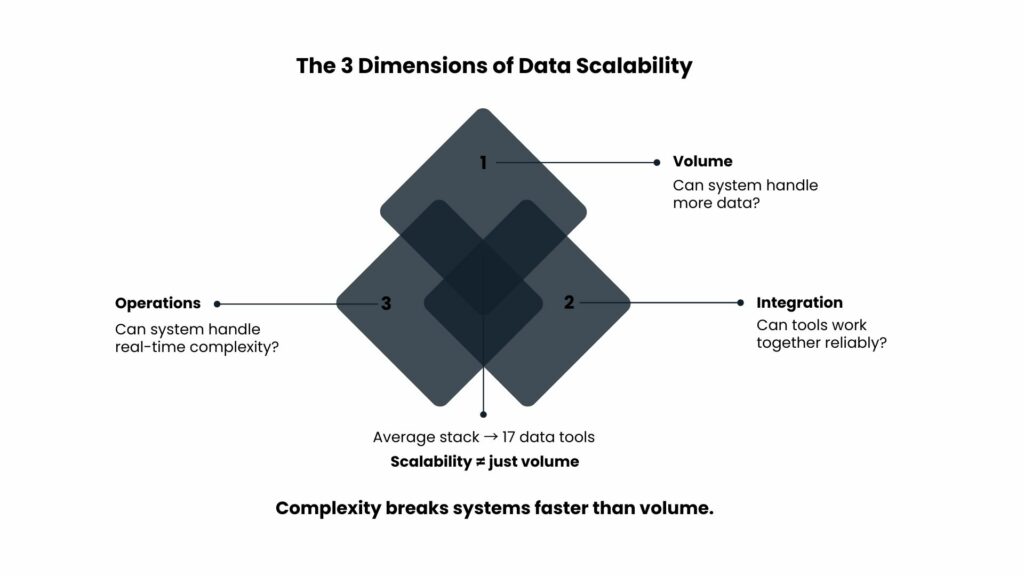
Data volume is no longer the differentiator. Most B2B companies already have way more data than they know what to do with. The big issue isn’t about having enough data; it’s whether the people making decisions trust that data enough to actually use it.

The organizations that thrive are the ones that invest in data trust architecture treat trust as infrastructure, not a by-product. Every measurement needs to be clearly defined and understood by everyone involved. When you treat trust as something concrete and build systems around it, teams start seeing how reliable their data is right in their workflow. This means no more wasting time; like 3.8 weeks per quarter just checking numbers, are needed before moving forward.

The organizations that will lead in the next phase of B2B intelligence are not those collecting the most signals. They are those who have built the infrastructure to verify, govern, and confidently activate the data they already have.

Reliable data is not a luxury. It is the foundation for every strategic advantage that follows.

Professional analyzing dashboards and system data illustrating challenges in data scalability architecture as data volumes increase

The Data Scalability Problem: Why Data Systems Fail as Volume Increases

Most data systems don’t fail at launch. They fail when they succeed; a fundamental data scalability architecture problem.

The CRM enrichment process that works seamlessly on 10,000 records fails on 100,000 records. The marketing automation system working perfectly with 200 leads every week fails once there is a campaign generating 2,000 leads. The system remains the same but its volume changes.

Based on Gartner’s findings from 2023, 47% of all data systems suffer from reduced functionality at a mere 3x the scale of their initial capacity. When it comes to RevOps, it results in inaccurate pipeline analysis, outdated intent scores, and SDRs reporting that contact information is lacking. The problem is not necessarily downtime; the issue is a slow degradation of trust in the accuracy of your data.

Understanding Data Scalability Architecture: Three Core Dimensions

Data scalability architecture encompasses three distinct dimensions that organizations often conflate when planning for growth.

Volume scalability focuses on pure throughput. Are you able to support 50,000 API enrichment requests per day compared to 5,000? But volume scalability alone doesn’t account for complexity. A system that handles 100,000 basic contacts may fail once you need to merge 10,000 records using multiple data sources, implementing deduplication and resolving conflicts with third-party APIs.

The need for integration of scalability increases as your infrastructure grows. Connecting three platforms such as Salesforce, HubSpot, and one enrichment tool can work just fine. Once you throw in Outreach, Gong, ZoomInfo, Clearbit, and a data warehouse, you have built an ecosystem of interdependencies, where a failure of one service affects all the others. On average, a B2B business uses 17 data tools, according to the ChiefMartec 2024 research.

Operational scalability is defined by the capability of your system to retain reliability amid varied usage patterns. For a startup, batch enrichment may be performed on a weekly basis. As for the growth phase, real-time enrichment is necessary on account of form submissions, chats, and integrations that must happen in parallel. According to Databricks’ research, 62% of failures in data pipelines result from such interactions, not volume.

Where Scalability Failures Manifest

Degradation of processing usually starts slowly but reaches a point where the increase becomes dramatic. If a data enrichment pipeline takes two minutes initially, doubling the number of records makes it take five minutes. Increasing by an additional twenty percent causes processing times to balloon up to forty-five minutes and leads to timeouts, job failures, and partial data sets. This is due to the nature of most processing systems having certain tipping points: queries becoming inefficient, rate limiting of APIs, memory exhaustion, and network limits.

Let’s consider a practical example. A Series B SaaS company that ran nightly enrichment pipelines extracting company data from three different providers, combining them, and then updating Salesforce found its enrichment process took forty minutes for five thousand accounts but three hours for fifteen thousand accounts. At 25,000 accounts, it failed entirely. Not because servers crashed, but because sequential API calls, conflict resolution logic, and Salesforce update operations couldn’t complete before the next batch started. The system wasn’t designed for scale. It was designed to work. This failure illustrates why data scalability architecture must be designed upfront, not retrofitted after systems break.

System overload creates downstream effects beyond slow processing. When enrichment services lag, sales teams start manually researching accounts, creating duplicate records, inconsistent data formatting, and bypassing validation rules. Salesforce reports from 2023 indicate that 34% of CRM data quality issues originate from workarounds created when automated systems fail to perform.

Integration failures multiply as systems scale because they operate on different assumptions. Your CRM expects responses within 10 seconds. Your enrichment provider’s SLA allows 30 seconds. At low volume, average response time stays under threshold. At scale, the provider’s 95th percentile response time exceeds your timeout, causing intermittent failures that are difficult to diagnose and impossible to prevent without architectural changes.
You can read more about this, here.

The Revenue Cost of Weak Data Scalability Systems

The cost of scaling failures extends beyond engineering resources. LinkedIn’s B2B Institute research found that sales teams using incomplete or stale data experience 27% longer sales cycles and 18% lower win rates. But the compounding effect is more severe.

When a successful campaign generates 800 leads in one day instead of the usual 100, the enrichment backlog grows to 3 days. By the time intent data is available, those signals are stale. The prospect who showed buying intent on Monday receives outreach on Thursday after they’ve already engaged with a competitor. The revenue impact isn’t from system failure. It’s from timing degradation that makes accurate data useless.

Pipeline visibility suffers disproportionately. The RevOps team requires comprehensive data to forecast, plan territories, and allocate resources. If the enrichment tools cannot match the amount of data being collected, then reporting is inaccurate. Based on the Forrester 2024 B2B Data Quality research study, “41 percent of revenue professionals said they made strategic decisions using incomplete data during periods of growth.”

The Scalability Design Framework

Effective data scalability architecture requires design decisions made before scaling pressure appears. The Throughput-Consistency-Latency triangle provides a decision framework.

Throughput measures volume capacity. How many enrichment operations per hour can your system handle? Increasing throughput typically requires parallel processing, which introduces consistency challenges. If three enrichment providers return conflicting company revenue data for the same account, which source wins? Sequential processing makes this decision straightforward. Parallel processing requires conflict resolution logic designed upfront.

Consistency ensures data accuracy across integrations. Eventual consistency, where different systems show different data temporarily, might be acceptable for some use cases but catastrophic for others. A sales rep viewing account data in Salesforce while a marketing automation system sends an email based on slightly different data creates customer experience issues.

Latency defines how quickly data must be available. Real-time enrichment requires fundamentally different architecture than batch processing. Organizations often demand real-time performance without considering the cost. Real-time systems need redundancy, caching layers, and fallback mechanisms that batch systems don’t require.

The strategic choice isn’t optimizing all three. It’s deciding which two matter most for your use case and architecting accordingly. High-volume lead enrichment might prioritize throughput and latency, accepting eventual consistency. Strategic account intelligence might prioritize consistency and latency, processing lower volumes with higher quality standards.

Building Modular Data Scalability Architecture

A robust data scalability architecture segregates functionality into independent yet loosely coupled modules. The architecture should avoid using a single big-enrichment model but rather employ an independent module-based approach that allows each transformation to run independently.

The initial stage will involve the creation of an ingestion module. Another stage will be to introduce a normalization module to standardize data. The third stage involves enriching data using another data module. Finally, the fourth stage entails distribution through yet another module. Scaling will depend on bottleneck analysis.

Asynchronous processing decouples data collection from enrichment from distribution. When a new lead enters your system, the immediate response confirms receipt. Enrichment happens separately. This prevents user-facing processes from slowing as backend operations scale. The trade-off is added complexity. You need queue management, retry logic, and monitoring to ensure eventual processing.

Caching strategies dramatically improve scalability for repetitive queries. If fifty sales reps view the same strategic account daily, enriching that account once and caching results for 24 hours reduces load by 98%. But caching introduces staleness. You’re explicitly choosing to show slightly outdated data for performance gains.

Implementing Data Scalability Architecture: Protection Strategies

Scalability protections need to be in place even before there is a failure.

Rate limiting and back pressure controls ensure that upstream services do not overload downstream services. For instance, if your enricher API supports 1,000 requests per minute, your ingestion system needs to limit itself to 800 requests per minute, which will provide room for spikes. Data prioritization tiers ensure critical operations scale first. Not all enrichment is equally valuable. A $500K enterprise opportunity needs immediate, complete enrichment. A $5K SMB lead can wait in the queue. Prioritization tiers allow avoiding the blocking of high-priority work by low-priority and large-volume tasks.

The choice of appropriate performance indicators is crucial. The average processing duration is almost meaningless, as it does not reveal anything about variability. In contrast, the 95th percentile of latencies – those slowest 5% – predict user dissatisfaction better. It’s critical to care about error rates, not uptime; in terms of actual service, when a system fails 15% of the time, it’s down anyway.

Conclusion: Scalability as Strategic Design

Data scalability isn’t a problem to solve after systems break. It’s an architectural decision made during initial design. The systems that survive 10x growth aren’t necessarily better engineered. They’re designed with different assumptions. They anticipate multiple integration points, plan for variable latency, and separate concerns into independently scalable components.

For RevOps leaders, the insight is all about timing. Investing in scalability before growth happens is exponentially more cost-effective than investing during the crisis. As far as tactics go, the insight here is measuring the right things. You’d be crazy not to measure 95th-percentile latency, error rates, and data freshness.

Data systems that fail under load weren’t necessarily built badly. They were built under different assumptions. This means that the question you have to ask yourself isn’t, “Can your current architecture scale?”, but “What did you plan for when it didn’t?”

Professional reviewing archived records and reports illustrating data validation B2B processes for accuracy and reliability

B2B Data Validation Systems: How to Test, Verify, and Trust Your Data Before Activation

Data validation B2B systems determine whether your go-to-market campaigns succeed or fail before they launch. Consider this example: An exemplary mid-market SaaS business took 6 months to develop an Account-Based Marketing/ABM initiative targeted at 5,000 high-intent accounts. They sourced and enriched their contact databases with technographic insight and executed the respective strategies. 3 months post implementation, the pipeline contribution was only 2% of planned projections.

There was no messaging or timing issue. A post-mortem review revealed that 34% of email addresses were invalid, 28% of titles were out-of-date, and 19% of companies had been wrongly categorized. Essentially, the team created a large-scale deployment of unvalidated data resulting in optimization on top of an already broken foundation.

This example happens each week throughout B2B organizations. Gartner states that poor data quality costs businesses approximately $12.9 million per year. According to Salesforce, the average sales rep loses up to 27% of their time working with bad data instead of selling. This is not just a few inefficient processes; this is a systemic revenue leak due to a lack of trust in data operations.

What Data Validation Actually Means

Data validation is a dynamic process that continuously verifies that one single query is fulfilled: Is this data credible enough to be used right now?

In most cases, businesses mistake data procurement for data credibility, as they acquire a mailing list, update their database accordingly, and think everything is ready. However, there are three fundamental areas where this logic falls apart.

Contact-level accuracy ensures that the contact is indeed present in that very role and can be reached in data validation B2B workflows. Does the email resolve? Does the number connect to the intended individual? Is the title current? Even small inaccuracies here directly impact connect rates and outreach efficiency.

Company attribute validation confirms that firmographic and technographic data reflects current reality. Is the headcount accurate? Is the technology stack still in use? Has the company been acquired? B2B data decays at approximately 30% annually due to job changes, company transitions, and technology migrations.

Segmentation logic verification ensures that the rules used to prioritize and route data produce intended outcomes. Are high-value accounts correctly identified? Does the scoring model match actual conversion patterns? This layer determines whether data is strategically usable, not just technically correct.

The distinction matters. Most teams validate fields. High-performing teams validate decisions.

The Three Validation Checkpoints That Drive Performance

Validation must occur at multiple stages of the data lifecycle, each catching different failure modes.

Pre-ingestion validation occurs before data enters your CRM or marketing automation platform. This checkpoint prevents contaminated data from polluting your systems. It includes email syntax verification, domain existence checks, duplicate detection, and basic deliverability assessment. According to research conducted by Forrester in 2023, businesses using pre-ingestion validation experienced a saving of 67% on data remediation costs compared to those using post-integration validation.

Post-enrichment validation ensures that enrichment operations have enhanced, rather than compromised, the quality of the data. A 2026 accuracy study of eight website visitor identification platforms found dramatic quality variation. The highest-scoring platform achieved 82% correct identification of known visitors, while the lowest returned entirely wrong individuals from unrelated companies. The study attributed quality gaps to underlying identification methods. Deterministic matching produced significantly fewer false positives than probabilistic methods that infer identity from behavioral patterns.

This means testing a sample of enriched records against known ground truth before trusting the entire dataset. Cross-verification of firmographic fields, role validation against organizational structure, and technographic consistency checks are essential at this stage.

Validation at the campaign level is the last hurdle before deployment. Ensure that your targeted list is of high quality before starting an outreach campaign. Run tests on the deliverability of your emails to a small number of contacts. Check that the phone numbers work.Confirm that company attributes match targeting criteria. Skipping this step leads to silent execution failures where campaigns run and data looks fine, but performance drops without clear attribution.

Common B2B Data Validation Failures and Their Revenue Impact

Most data validation B2B failures follow predictable patterns, each with compounding costs.

Skipping validation entirely is the most common and most expensive failure. Teams assume that purchased data is validated by the vendor. According to a survey conducted by Integrate, almost 50% of marketers take more than ten hours each month for data cleansing. However, this effort can be greatly minimized through validation procedures.

Over-reliance on vendor claims creates hidden risks. A vendor’s claimed accuracy rate is a marketing statement, not a guarantee. “95% accuracy” is often measured at the field level, averaged across datasets, and not reflective of your target segment. Without independent validation, these metrics are misleading at best.

The absence of systematic checks leads to ad hoc validation. In the absence of automated data validation processes, data quality deteriorates without anyone’s knowledge until an audit takes place manually. Close to 75% of marketing professionals believe that at least 10% of their leads have erroneous information. Over 60% of companies find data quality issues interfering with lead transitions. The impact is quantifiable. When validation fails, SDRs lose an average of 545 hours per year dealing with bad data. For a team of 10 SDRs, you are effectively paying for two full-time employees to spend their entire year navigating data errors instead of selling.

Building a Practical Validation Framework

Effective data validation B2B systems combine statistical rigor with operational efficiency.

Stratified sampling methods guarantee validation coverage without having to go through 100 percent manual verification. If the number of contacts is less than 1,000, then apply the method of stratified sampling for validation at 15 percent on criteria such as data origin, seniority level of the contact, company size category, and recency of acquisition. If error rates in any segment exceed 10%, expand sampling or reject the data entirely.

Multi-source verification cross-references critical attributes against independent data sources. No source of information can be considered entirely accurate. Validating contact data through several vendors makes the process of validation much more robust, validating firmographic data against publicly and privately sourced data strengthens it, and validating signals of intent with behavior data enhances it.

Automated validation rules enable continuous validation at scale. Manual validation does not scale. Key automation examples include flagging records with conflicting firmographic data, identifying outdated job titles based on tenure thresholds, detecting anomalies in enrichment fields, and scoring records based on confidence levels. Modern CRM platforms now enable real-time checks on save, on import, and via scheduled bulk jobs.

Embedding Data Validation B2B into GTM Workflows

Data validation B2B workflows fail when disconnected from execution. They must embed directly into daily operations.

CRM level validation checks for the validity of each data entry before accepting it and discards incomplete or low-confidence records. It also calculates the confidence score of each record.

Campaign readiness filters apply before activation. Exclude any contact not verified in the last 30 days. Set minimum confidence score requirements. Verify ICP alignment criteria and contactability thresholds. This single filter eliminates the majority of decay-related failures.

Continuous validation loops maintain data freshness between campaigns. Key feedback signals include bounce rates, connect rates, reply rates, and conversion performance. Incorporate the feedback from these signals into the validation process to adjust the rules, re-evaluate the trust score, and select better data.

Practical Data Validation B2B Recommendations for Revenue Teams

Begin with an initial assessment. Take a sample of 10,000 records among the vendors and manually verify 500 accounts to measure your initial trust score.

Build core framework elements within 30 days. Implement 12 automated checks covering email deliverability, firmographic accuracy, and intent signal validity. Apply stratified 2% sampling per segment and cross-reference against three vendors minimum.

Integrate validation into workflows within 90 days. Use plugins to auto-quarantine imported records. Conduct weekly campaigns using 1,000 record tests. Produce scorecards each week for revenue leadership that display validation coverage trends.

Test the validity of validation itself by examining measures such as quarantine ratio, validation coverage, false positive ratio, and time-to-detection.

Conclusion: B2B Data Validation Trust Must Be Engineered

Most B2B organizations do not have a data problem: they collect, enrich, and activate it. They have a data trust problem. But they do not verify it.

Without validation, even accurate data becomes unreliable in execution. We must transform data gathering into data verification, trust in vendors into trust in systems, and static quality into ongoing validation.

Almost half of all RevOps practitioners say that poor data quality leads to inefficient pipeline management. Almost half believe that data discrepancies happen often or always within their organizations. These companies launch unverified data and pay for it indefinitely.

Competitive advantage in data validation B2B doesn’t come from having more data, it comes from having data you can trust. Validation is not a cost center. It is the foundation of predictable revenue and the difference between a guess and a qualified opportunity.

Professional reviewing analytics dashboard highlighting the importance of B2B data freshness in decision-making

B2B Data Freshness: Why Fresh Data Beats Accurate Data

Your CRM shows 94% data accuracy. Your vendor refreshed the database three weeks ago. Yet your SDRs are burning hours on disconnected numbers and outdated contacts. The data is not wrong. It is just no longer right. This is the B2B data freshness gap: the critical window where technically accurate data loses operational value. While accuracy measures correctness at a point in time, B2B data freshness measures real-time usability. Understanding this distinction is essential for modern RevOps teams.

According to Gartner, poor data quality will cost organizations on average $12.9 million a year. However, if we factor in the impact of freshness decay, the costs will be much higher than that. B2B contact data degrades at a rate of about 30% per year, while in technology, VP-level contacts are likely to churn at 40-50% annually. Most RevOps teams currently optimize for accuracy; however, they should be optimized for timeliness.

For example, a record that has an email address that is 45 days old can be thought of as meeting the criteria for ‘accuracy’ set by most vendors. However, if that contact’s job title changed 30 days ago, then your outbound engagement sequence will end at that point – (you have evaluated based on the wrong measure).

B2B Data Freshness: Why Timing Defines Intelligence Value

B2B data freshness requires understanding three categories of constant movement.

The first is personnel movements, which are extremely fluid. According to the recently released workforce data by LinkedIn, the average tenure on the job for tech sales roles is 1.8 years, a decline from 2.4 years in 2019. Therefore, your ideal customer profile contact list loses its validity at a rate of 4-5% per month for high velocity organizations. For fast-growing industries like technology, healthcare, and professional services, this figure stands at 30-40%.

There are organizational changes as well, which include alterations to targeting criteria and hierarchy. When a target company spins off a division or merges with another entity, your account mapping becomes instantly obsolete. These changes cascade across potentially hundreds of records.

Technology and intent signals degrade rapidly because they reflect current behavior and priorities. A company researching marketing automation platforms in Q1 may have already selected a vendor by Q2. Intent data has a functional half-life measured in weeks, not months. Research suggests that intent signals show maximum relevance within a 30-45 day window, after which predictive value drops by 60%.

The compounding effect is severe. A record with outdated contact information and stale intent signals and incorrect organizational hierarchy is not three problems. It is a total targeting failure.

Data Freshness vs. Data Decay: The Critical Distinction

Most vendors conflate freshness with decay prevention, but these represent fundamentally different data qualities.

Data decay is deterioration. It is the natural entropy where previously accurate information becomes incorrect over time. A phone number that worked six months ago but is now disconnected. An email address that bounces. These are measurable inaccuracies.

Data freshness is real-time usability. It measures the degree to which information reflects current operational reality, regardless of historical accuracy. A contact who was correctly listed as Marketing Director three months ago but promoted to CMO last week presents a freshness problem, not a decay problem. The original data was never inaccurate. It simply became outdated.

This distinction exposes a critical vendor blindspot. Most data providers measure accuracy through verification cycles: “We validate emails monthly” or “Phone numbers are checked quarterly.” But verification cadence does not equal freshness. A quarterly refresh cycle means your data is, on average, 45 days old at any given moment. For roles with high velocity, 45-day-old data can easily be 15-20% stale.

Here is the distinction that matters: a dataset can be 100% accurate for the moment it was captured and 100% unusable for today’s execution.

Where B2B Data Freshness Gaps Cost You Deals

Freshness gaps emerge at three critical junctures.

Between data refresh cycles, the gap widens linearly. If your vendor refreshes data monthly, day one post-refresh represents peak freshness, but day 30 carries accumulated decay. Most vendors update their central databases on 90-120 day cycles. With data decaying at 2-3% monthly, approximately 3-6% of the contacts you purchase will be invalid on the day of delivery simply due to the age of the record.

Between enrichment and execution, delays create tactical gaps. Marketing identifies high intent targets, initiates enrichment to create contact lists, and passes to sales. If your enrichment period is 72 hours, and you start your sales cadence after another 48 hours, you’re reacting to signals that are five or more days old. For competitive deals or time-sensitive triggers like funding announcements, executive changes, or technology implementations, this delay materially reduces conversion probability.

Across global datasets, regional refresh rates vary dramatically. US-based data benefits from more frequent updates and higher-quality sources than EMEA or APAC datasets. A vendor claiming “monthly refresh” may refresh US records monthly but EMEA records quarterly. Global GTM teams operating under assumed data parity are making targeting decisions on fundamentally different freshness baselines.

The Data Freshness Tax: GTM Performance Impact

The freshness gap manifests in three measurable GTM failures.

Missed opportunities from timing gaps. Intent signals and trigger events have narrow windows. A company posting a job requisition for a new RevOps leader signals evaluation-stage interest in relevant tooling, but only for 30-60 days. Acting on this trigger 45 days late means entering conversations after shortlists are formed or decisions made. Data shows that response time to intent signals correlates with 35% higher demo-to-opportunity conversion when contact occurs within 14 days versus 30+ days.

Reduced contactability from role churn. Email decay has increased rapidly to 3.6% monthly. Rates higher than 2% can lead to penalties from Gmail and Outlook. This will significantly lower deliverability rates. Anything above 5% may result in blacklisting, which can take several months to resolve. ZoomInfo found out that sales representatives spend about 27.3% of their working hours addressing erroneous information. That translates to 546 hours per year per representative.

Outdated targeting due to organizational lag. Account-based selling requires fresh data regarding organization structure, technology stack, and firmographics. As soon as the target organization upgrades to a new CRM and marketing automation tool, you have lost ground in the competition. If you cannot adapt within 60-90 days, you will be offering integrations that they already have in place.

Data Freshness Framework: Evaluating B2B Data Fitness

Not all data requires the same level of freshness. Evaluate B2B data freshness needs across two dimensions.

Contacts, job functions, telephone numbers, and intentions indicate high variance. Structure of hierarchy, structure of technology, and headcount indicate moderate variance. Age of establishment, industry, and headquarters indicate low volatility.

Impact measures the cost of using stale data. Primary contact, decision-maker role, and active intent signals have high impact. Supporting contacts, account hierarchy, and firmographics have medium impact. Background information, historical data, and reference fields have low impact.

This creates a matrix with nine data fitness categories. High volatility and high impact information, such as contacts of decision makers who show signs of intention to act, need frequent updates. Low volatility and low impact data, for example the date of foundation of a company, may be updated annually or quarterly.

Building Data Freshness Systems: Beyond Batch Updates

Traditional data strategies optimize for accuracy. Modern B2B data freshness systems optimize for recency and relevance.

Continuous refresh models replace batch updates with streaming or near-real-time updates for high-value segments. Instead of refreshing 100% of your database each month, consider refreshing daily or weekly for active opportunities, high intent accounts, and ICP segments. An example of a tiered refresh approach includes refreshing tier 1 active opportunities daily, tier 2 high intent accounts weekly, tier 3 database monthly, and tier 4 dormant accounts quarterly.

Triggers will ensure that data stays fresh whenever possible by automatically triggering a refresh based on specific trigger events. For example, when someone changes their role on LinkedIn, when a company acquires another business, when there is a change in technology stack, then all this information would be updated.

Freshness built-in workflow means that you integrate your workflows with your data. Before an SDR launches a sequence, before marketing sends an ABM campaign, automated freshness validation flags records older than defined thresholds. Surface “last verified” dates in CRM workflow views and require SDRs to validate any contact older than 60 days before inclusion in sequences.

Implementing B2B Data Freshness: 4 Practical Steps

Consider data freshness, not just accuracy. Introduce “average age of data” and “age of data at time of conversion” into your data quality dashboard. Measure freshness on a per-record-type, per-source, and per-segment basis. An “average age of data” of 18 days for closed-won deals versus 52 days for closed-lost is an indicator of freshness as a conversion element.

Negotiate fresh vendor contracts. Instead of a broad “refresh monthly,” demand an age limit on the data for the key fields. Also demand that vendors provide average data age statistics by field, and support triggers for updates when necessary.

Build freshness decay curves for your ICP. Different roles and industries show different decay rates. Map your target personas against actual observed decay to establish persona-specific refresh requirements. Track how quickly titles, phone numbers, and emails become invalid.

Implement operational freshness gates. Do not allow records older than defined thresholds into high-value workflows. If a strategic ABM campaign targets 200 accounts, require all primary contacts to be verified within the previous 30 days before campaign launch.

Data Freshness as Competitive Advantage

The fundamental error in B2B data strategy is treating information as a persistent asset. Data is not persistent. It is perishable. Learn more here.

The accuracy-freshness distinction separates leaders from laggards. B2B data freshness is not a feature, it’s a competitive requirement. RevOps leaders need to think about data quality criteria in terms of relevance, not historic precision. An 85% accurate database that is 30 days old is less relevant than an 82% accurate database that is only one week old. Freshness is an attribute of quality, not functionality.

The companies that will dominate revenue execution over the next decade will be those who see their data as an ongoing stream, not a static asset. They will allocate resources for platforms that favor freshness over comprehensiveness, that optimize refreshing, not uniformity, and that evaluate data quality in real-time, not at collection.

Your data is decaying right now. The question is not whether you can afford to prioritize freshness. It is whether you can afford not to.

Professional presenting analytics dashboard illustrating the need for a data obsolescence strategy in evolving data systems

Data Obsolescence Strategy: Why Every Dataset Needs One

Every B2B organization needs a data obsolescence strategy. Your data warehouse contains every lead interaction over the last seven years, and some customer records date to 2018.

Yesterday, a member of your analytics department spent three hours fixing a report that included prospects from the past five years completely forgetting to compare that data with any actual contacts that changed organizations. While the analysis from that report has no value, the opportunity loss caused by mistakes made while creating it does. A structured data obsolescence strategy prevents this waste.

Poor data quality costs organizations an average of $12.9 million annually. MIT Sloan Management Review research indicates companies lose 15 to 25% of revenue due to bad data. 85% of companies attribute bad decision-making directly to stale data. B2B contact data decays at 2.1% per month, meaning 70% of your database becomes unreliable within three years. Yet most organizations treat 7-year-old prospect records identically to seven-day-old intelligence.

Storage is cheap. Confusion is expensive. Data that outlives its relevance does not become neutral. It becomes a liability that pollutes decision systems, degrades model performance, and creates governance problems. This is the problem that data obsolescence planning solves.

The True Cost of Ignoring Data Obsolescence Strategy

How Stale Data Creates Conflicting Analytics Insights

When current and historical data coexist without clear temporal separation, analytics systems generate contradictory outputs. An old firmographic record classifies an account as a small business. A new record reflects its growth into an enterprise. Both sit in your pipeline. Your segmentation engine pulls from both. Your marketing team and sales team draw different conclusions from the same system and neither trusts the other’s numbers.

This is a huge issue for those who rely on buyer intent signals and account intelligence. If prospects showed interest as an intent signal six months ago, then those figures may no longer be valid if the buying committee completely overhauled, if they added new line items to the budget, or if they changed strategic priorities.

Therefore, your team may still be pursuing opportunities that disappeared five or six months back due to not having any sort of method to identify and rule out these types of stale signals.

Preventing ML Model Drift Through Data Expiration

Machine learning models trained on historical data perform poorly when underlying patterns shift. A lead scoring model built on 2021 buying behavior fails in today’s market where decision cycles, committee sizes, and evaluation criteria evolved substantially. Harvard Business Review research shows many ML models lose 20 to 30% predictive accuracy within months when training datasets are not continuously refreshed.

Organizations using AI-driven lead prioritization face a specific vulnerability here. When models ingest firmographic and technographic data that is eighteen months old, they produce high scores for stagnant companies and low scores for rapidly scaling prospects. The model appears to function while generating outputs that consistently mislead the sales team.

Reducing Compliance Risk with Data Expiration Policies

Every retained record demands governance attention: backup, security, audit inclusion, and compliance tracking. UK private sector researchers found that businesses saved 41% of stored data without a business reason, costing an estimated 3.7 billion pounds annually. Individual businesses average 213,000 pounds in annual storage and management spending, much of it on data that they should have discarded years ago.

For B2B organizations managing contact data across jurisdictions, the regulatory exposure compounds. GDPR’s data minimization principle requires retaining only what is necessary for stated purposes. Fines for serious violations reach 17.5 million pounds or 4% of global turnover. An organization holding seven years of accumulated personal data carries far more exposure than one with a disciplined expiration strategy.

Three Types of Expiration Policy

Time-Based Expiration

The simplest and most common approach: data expires after predetermined periods reflecting typical useful lifespan. Contact enrichment data refreshes every 90 days. Behavioral engagement signals expire after 180 days. Campaign interaction logs archive after one year. Intent signals carry a 60-day active window before decay weighting reduces their influence to zero. Organizations implementing time-based policies report 30 to 40% reductions in active data volumes without material impact on analytical capability, because the expired data provided minimal ongoing value.

Event-Based Expiration

Some data should expire based on business events, not calendar time. A prospect’s intent signals expire the moment they sign with a competitor. Firmographic records trigger re-enrichment following an acquisition. Technographic datasets reset when a company migrates its technology stack. Contact enrichment refreshes automatically when someone detects a job change.

Event-based policies align data lifecycle with business reality. When deals close as won or lost, granular interaction history loses operational relevance. The aggregate learning matters. The contact-level detail does not.

Relevance Scoring: Advanced Data Obsolescence Control

The most sophisticated approach uses measurable signals to determine when data has passed its useful life. Has anyone accessed this record in the past year? Does it score above minimum thresholds in your ICP model? Does any active campaign or model reference it? Records falling below defined relevance thresholds trigger expiration regardless of age or events. At Packed Data, we establish the foundation of the refresh velocity model: we continuously score intent signals and technographic data and automatically expire them when they fall below the threshold required to inform a meaningful sales decision. The goal is a database where every active record is worth acting on.

How to Operationalize Your Data Obsolescence Strategy

Building an effective data obsolescence strategy requires three operational components:

Automated Data Archival for Continuous Hygiene

Manual data cleanup is not done consistently, as most teams don’t want or have enough time to do this consistently. Automated archival processes remove expired data from the active environment to a long-term storage or archival solution based on predefined procedures, and these solutions execute automatically without any human interaction.

Organizations who have implemented automated archival systems typically have experienced 25 to 35% improvement in query performance as the size of the active data set shrinks to only those records that are operationally relevant. In one case, a retail organization, which automated its archival process, experienced a reduction in data storage costs of 60% along with a 45% increase in query speed.

Tiered Storage: Cost-Efficient Data Lifecycle Management

Not all data that has reached its end of life requires hard deletion. As relevance decreases, the system will migrate tiered storage through increasingly lower-priced tiers until the data is either permanently deleted or reaches its end of life (EOL). Active operational data remains in fast performance databases (millisecond query speed), while recently expired data gets archived into standard cloud storage (low cost). Older historical data moves into cold storage (archival storage). Permanent deletion occurs only after all required legal retention periods have been satisfied.

By managing the various categories of storage and retention obligations through a tiered storage strategy, you can optimize the cost of storing data while retaining the ability to recover that data if needed, comply with data retention obligations, and prevent compliance-related data from adversely affecting operational analytics.

Managing Access Controls for Expired Data

Active systems manage archived data differently from how they manage current data. When there are no access restrictions, analysts might mistakenly include expired records in analyses, training data sets, and reports. Utilize the concept of least privilege for accessing archived data (sales and marketing should only access current intelligence, and analytics should receive only recent historical data to perform trend analysis; compliance should receive full archives when the retention period is mandated). By having expiration date and tier meta tagging on each record will make the enforcement of access systematized rather than manual.

Data Obsolescence Strategy ROI: The Business Case

A B2B SaaS organization that implemented a structured data obsolescence strategy across its account intelligence database reported storage costs dropping from $180,000 to $65,000 annually, lead scoring accuracy improving from 72% to 93%, decision velocity increasing by 25%, and $5.4 million in incremental revenue attributed to cleaner targeting. A fintech firm that refreshed eighteen-month-old firmographic data recovered $3.7 million in ARR from accounts that had been misrouted to wrong territories.

The compliance benefits add up alongside the financial results. Automatic expiration can lead to up to 80% less exposure to personal data and it also halves the time required for audit preparation. In 2024, the average costs of data breaches were $4.88 million and companies that have well-established data governance programs have breach costs that are 45% lower. Each record that is deleted means one less exposure to data breach risk.

Building Your Data Obsolescence Strategy: First Steps

Start your data obsolescence strategy with these practical steps. Conduct a staleness audit. Take a sample of 500 records from your current CRM/account intelligence database and determine when they were last validated. You will want to flag anything greater than 90 days old for contacts, greater than 180 days for intent signals, and greater than 12 months for firmographic data. The percentage of records that do not meet these thresholds is your current level of obsolescence.

Define expiration policies for your three highest-volume data types. Build time-based rules, identify business events that should trigger re-enrichment or expiration, and set the relevance thresholds that mark a record as no longer actionable. Automate enforcement so the system maintains itself.

Packed Data’s continuous enrichment model is built on this principle: enrichment is not only additive. It overwrites what is old. The CRM integration for sales intelligence acts as a constant filter, identifying contacts who left their companies, accounts that changed their technology stacks, and intent signals that aged past the point of actionability. The result is a database where everything present is worth using.

Data strategy isn’t only about what you collect, but also about recognizing when that data is no longer relevant.

Analyst reviewing dashboard metrics illustrating B2B data quality dimensions in modern data-driven decision making

Data Quality Dimensions: Beyond the 99% Accuracy Myth

Understanding B2B data quality dimensions is critical to avoiding costly mistakes. Your VP of Sales celebrates: “Our CRM data is 99% accurate!” SDRs prioritize hot leads. Pipeline explodes. Then close rates tank. Why? Perfect names and emails, wrong companies. The 99% accuracy fooled everyone because data quality requires more than precision; it demands relevance, completeness, and context.

Organizations proudly claim their data is “99% accurate.” Yet strategic decisions still fail. Campaigns miss targets. Forecasts drift. Investments underperform. While 64% of organizations rate data quality as their top integrity issue according to Drexel University’s 2025 research, most people focus obsessively on accuracy metrics while ignoring the dimensions that drive business results.

The uncomfortable truth: accuracy on its own does not really guarantee usefulness. The poor data quality is draining U.S. businesses to the tune of $3.1 trillion annually, with one single organization splitting the loss of $12.9 to $15 million per year. Data that is technically correct but without relevance, completeness, or context can still lead to incorrect conclusions.

When Accurate Data Misleads

Teams over-index on accuracy because it is measurable. Accuracy percentages provide a sense of certainty. They signal rigor. They give comfort to stakeholders that their choices are backed by evidence. In the case of a marketing manager or an SDR lead, it is far more straightforward to claim that the database is accurate up to 99% than to justify the reason why the campaign did not bring any pipeline. But this focus creates false comfort. Consider common scenarios:

Sales forecasts built on accurate historical data but ignoring market shifts Customer analytics based on precise engagement metrics but missing intent signals Market sizing calculations derived from exact industry counts but overlooking buying readiness.

In each case, the data is accurate yet strategically misleading. You have a 100% accurate list of Chief Technology Officers at Fortune 500 companies, but if you are selling a product designed for mid-market DevOps teams, that “perfect” data will lead to a 0% conversion rate.

A contact record has a perfectly accurate email address and phone number yet is completely useless if the person left the company six months ago, never had budget authority, or works in an entirely different department than your solution serves. The email validates. The phone connects. The data passes every accurate check. And yet, it produces zero pipeline value.

Precision without relevance produces confidence without clarity.

The Four Critical B2B Data Quality Dimensions

A holistic view of B2B data quality dimensions includes four interconnected elements. At Packed Data, we view data quality not as a single score but as a balanced ecosystem of these critical dimensions.

Accuracy

Accuracy answers a narrow question: Is the data correct? It guarantees that the fields are valid, the figures correspond to reality, and the records are without mistakes. Is the email address valid and accurate? Is the phone number still active? Does the company name accord with the official registration documents?

While accuracy still matters, it plays a foundational role and by itself is not enough. B2B data becomes outdated at a rate of 2.1% monthly on average, so even “accurate” data is nearly a quarter-old if there has been no real-time checking. Analysis of the business contacts data revealed that 70.8% of the contacts were altered in one year.

Relevance

Relevance is concerned with whether the decision at hand requires the data. Highly accurate data about the wrong variables adds noise rather than insight. This involves technographic data, knowing exactly what software a prospect uses, and ideal customer profile analytics.

Knowing a company uses Salesforce is accurate. But is it relevant? If you sell Salesforce implementation services, absolutely. If you sell manufacturing equipment, probably not. Using accurate data that is irrelevant to your sales motion is the fastest way to burn through your marketing budget.

Completeness

Completeness evaluates whether critical information is missing. Incomplete datasets create blind spots that distort analysis. Even highly accurate data loses value when key attributes are absent.

A contact record might have an accurate name and title, but without reporting relationships, decision-making authority, budget responsibility, or current project involvement, you cannot use it to drive qualified conversations. A valid email is accurate, but it is incomplete if you don’t know the company’s recent funding round, their current intent signals, or their existing vendor relationships.

In go-to-market contexts, missing elements such as buying intent, organizational changes, or technology stack shifts significantly alter conclusions about opportunity or risk.

Context

Context is what shapes the way data is interpreted. Metrics only become meaningful when they are set against the larger backdrop: market trends, competitive landscape, organizational strategy, and economic environment.

An organization of 500 people could be a significant mid, market opportunity or a failing business that has just had a huge layoff. The number of employees is correct. Without growth trajectory context, it is strategically meaningless. Contextual data includes buyer intent signals: is the company researching your category right now, or are they browsing general educational content?

Without context, data becomes ambiguous. Acting on accurate data at the wrong time, such as reaching out during leadership restructuring, permanently damages your brand’s reputation.

How Accuracy-Only Thinking Fails

Organizations prioritizing accuracy while ignoring other data quality dimensions encounter predictable failures.

Perfect data answering the wrong question

Teams frequently optimize measurement systems around available data rather than strategic needs. This leads to dashboards that are meticulously accurate yet strategically irrelevant. A SaaS company meticulously validates email deliverability across their prospect database, achieving 99.2% accuracy. Marketing celebrates this metric while campaign response rates languish at 0.8%.

Tracking campaign performance with precision does little if the campaigns target the wrong audience segments. You might accurately identify a prospect is a “VP of Sales.” Without real-time company insights, you miss the fact their company went through a merger, making them a high-churn risk rather than a high-growth prospect.

Missing contextual signals

Many critical signals exist outside internal systems. External signals like market expansion, leadership changes, technological adoption, and competitive activity have a profound influence on results but most of the time they are not tracked. Companies that use only internal metrics may miss the changes that are changing the way customers behave.

An example of Unity Technologies’ Q1 2022 data quality incident shows how reliable data without contextual understanding can lead to unhappy results. The platform had correct numerical data but lacked the contextual intelligence to interpret what those numbers signified. The result? Millions in lost revenue despite technically accurate reporting.

Overconfidence in narrow datasets

Accurate data creates overconfidence when derived from limited sources. Single-source datasets may lack diversity of perspective, increasing the risk of biased conclusions. Organizations measure what’s easy to validate like email syntax, phone format, and company name spelling, and extrapolate that precision across unmeasured dimensions.

Your database might achieve 95% accuracy at the moment of capture yet become 70% obsolete within a year through natural business dynamics no validation check catches. The most valuable data dimensions, budget authority, active projects, technology adoption stage, and competitive evaluation timeline, change continuously and resist easy validation.

Designing Holistic B2B Data Quality Models: All Dimensions Matter

To overcome the accuracy fallacy, organizations must redesign data strategies around business questions rather than technical metrics.

Business-question-first design

Start with decisions, not datasets. Key questions should guide data collection: What strategic choice must be made? What signals indicate success or risk? What information gaps could mislead us?

Rather than collecting accurate data and hoping it proves useful, define business outcomes first. Identify accounts most likely to convert within 90 days, for instance. Then assemble the specific data dimensions that predict those outcomes: buying signals, technology fit, budget timing, and decision-maker engagement.

At Packed Data, we help organizations bypass the accuracy fallacy by layering buyer intent signals and real-time company insights. This approach ensures data relevance from the outset.

Context enrichment

Raw data is more valuable when additional dimensions are added to it. Some of the dimensions would be firmographic and technographic attributes, behavior and intent indicators, organizational change signals, and industry, specific benchmarks.

Data points by themselves are like pieces of a puzzle. When you put the puzzle together, you can see the picture. So do not be satisfied with the name and position of a person. Take advantage of the Packed Data platform, for example, to find out the intent signals that indicate when a prospect is beginning a buying cycle. It is quite a strategic move to figure out the growth trajectory, technology adoption gaps, and hiring trends of a company after knowing that the company has just raised Series B funding.

Multi-source validation

Combining multiple independent sources not only increases reliability but also the completeness of the information. When datasets are used for validation purposes, they can reveal differences, help in reducing bias and also increase the certainty of the conclusions.

One way to do this is by cross, referencing firmographics from several providers, confirming intent signals with engagement data from first-party, and continuously updating the records. The tactic reflects the way high, performing revenue teams combine CRM data, intent signals, and market intelligence to create a comprehensive view of their opportunities.

By 2026, the ‘Single Source of Truth’ is generally considered to be a myth. The strongest companies nowadays rely on multi-source validation, they do this by cross-referencing account intelligence with real, time platform insights so as to check for any discrepancies in their data which otherwise would have been a static snapshot from six months ago.

Business Impact of Holistic B2B Data Quality Dimensions

Moving beyond accuracy to embrace all B2B data quality dimensions delivers tangible strategic benefits.

Better strategic alignment

Relevant and contextualized data brings the teams together around common realities instead of each one working with isolated metrics. Marketing, sales, and leadership function from the same joint understanding of market conditions and priorities. Sales departments reveal that if they are provided with deep background intelligence instead of only having contact data that is accurate, they will be able to give more specific information to the prospects relating to their current issues, competitive positioning, and the right time for technology adoption.

Fewer wasted initiatives

Many failed initiatives stem from misinterpreting data rather than lacking effort. Holistic data quality reduces false starts by ensuring decisions reflect real conditions rather than partial views. Sales teams waste 27.3% of their time pursuing bad leads. Organizations implementing holistic quality models dramatically reduce wasted effort through AI-driven lead prioritization evaluating prospects across multiple quality dimensions.

Higher ROI from data investments

As businesses invest huge sums in analytics tools, the returns are often very disappointing. The problem is not with the technology but how the data is presented and understood. When data quality models go beyond accuracy to include relevance and context, the derived insights become actionable, resulting in improved outcomes across functions.

Research shows organizations using AI for data quality improvements report 30% accuracy enhancements within the first year, but more importantly, they see 20% better campaign response rates, 15% higher close rates, and 12% increased conversion rates.

From Precision to Intelligence: Mastering B2B Data Quality Dimensions

The modern competitive landscape rewards organizations that master all B2B data quality dimensions, not just accuracy.

Organizations spending more than $420 billion annually on big data and analytics still find that only 38% of CEOs report having the right insights to achieve their commercial goals. If the data is “accurate, ” then why are 86% of B2B purchases still stalling?

Leaders should consider not just asking “Is this data correct?” but also “Is this the right data, in the right context, for the right decision?” At Packed Data, we view account intelligence and contact enrichment through the lens that a correct email is only the start. Adding buyer intent signals and real-time company insights, we guide you to focus on data that really changes things.

Companies that accept this expanded view stop merely measuring reality and start comprehending it. Accuracy is the floor, not the ceiling. In a world where 81% of buyers initiate first contact with sellers, your data cannot be “correct” alone. It must be insightful. For a revenue leader, the only metric that matters is actionability.