

Your pitch deck claims a $50 billion total addressable market. The board simply nods their heads. Six months later, your sales team manages to close only three deals from a pipeline of thousands. The disconnect? Your market sizing was built on industry reports, not reality. You need accurate TAM SAM SOM calculation.
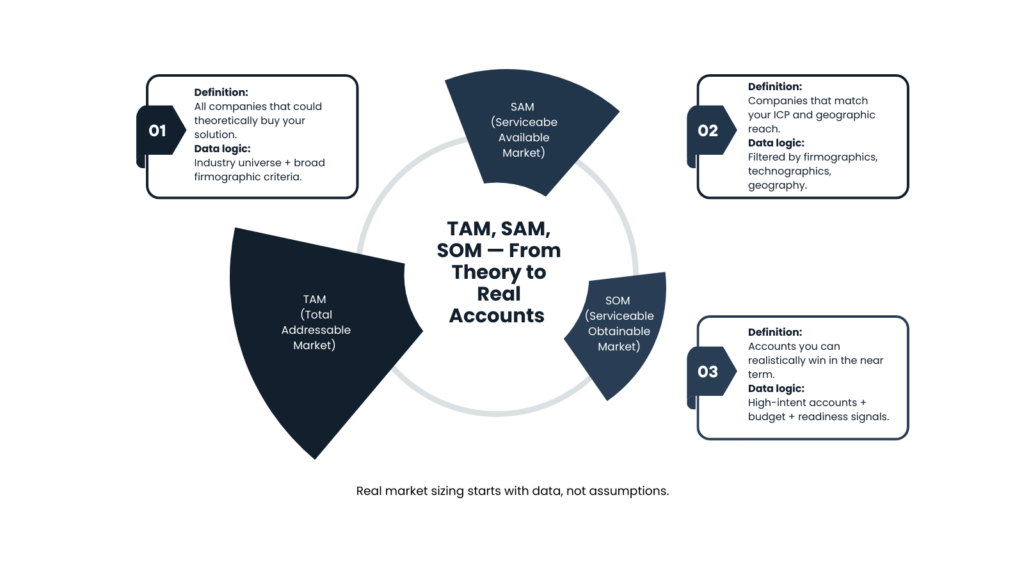
For data-driven founders, CMOs, and demand generation heads, mastering TAM SAM SOM calculation determines everything from funding success to sales quota accuracy. The main differentiator between companies that scale efficiently and those that burn through capital chasing imaginary markets is one factor: the accuracy of their TAM (Total Addressable Market), SAM (Serviceable Available Market), and SOM (Serviceable Obtainable Market) calculation.
Traditional top-down market sizing fails because broad industry figures don’t reflect your actual addressable market. The path forward requires bottom-up TAM SAM SOM calculation powered by firmographic data, technographic intelligence, and real-time company insights. This is where platforms like Packed Data Services transform abstract market numbers into actionable account lists.
The Flaw in Top-Down Market Sizing
Most founders calculate TAM using the top-down approach: find a Gartner report stating, “the global CRM software market is $70 billion,” estimate what percentage applies to your niche, and present the number to investors. This method is fast, convenient, and fundamentally flawed for go-to-market planning.
Top-down sizing starts with broad industry figures and narrows down through assumptions. While useful for quick context in pitch decks, this approach suffers from critical limitations. Industry reports aggregate diverse submarkets that don’t align precisely with your offering. The data is often outdated by months or years. Most critically, top-down numbers tell you nothing about who your actual customers are or where to find them.
Research shows companies relying solely on top-down market sizing miss up to 80 percent of high-intent leads. When you claim a $50 billion market without understanding the specific companies within it, you’re building strategy on sand.
Investors see through this. Venture capitalists evaluate startups partly based on TAM calculations, but they’ve seen countless decks claiming massive markets that never materialize into revenue. According to analysis of startup fundraising, investors expect more than large numbers. They seek well-reasoned, data-backed approaches to market sizing.
When a healthcare software company assigns generic market size to “all hospitals globally” without segmenting by size, budget capacity, or technology readiness, the resulting GTM strategy wastes resources pursuing accounts that will never convert. The sales team chases prospects outside their ideal customer profile. Marketing spend disperses across irrelevant segments. Pipeline metrics look impressive while actual revenue stagnates.
Bottom-Up Precision: Counting the Customers One by One
The bottom-up approach to market sizing is about building up the market from the ground level by adding the number of potential customers times the average revenue per customer. This method compels entrepreneurs to precisely identify their customers, count the number of each type of customer, and set prices that make sense.
The equation is simple: TAM is the total potential customers multiplied by the customer’s average annual revenue. For instance, a software company charges $15, 000 per year for project management and there are 4.5 million businesses worldwide using those tools, your TAM will be about $67.5 billion. Thus, this estimation of the addressable market is based on real and justifiable assumptions.
Bottom-up analysis is often preferred by investors because it demonstrates homework. You know your target customer profile, how many exist, and the value of each one. The approach naturally ties into your go-to-market plan by identifying where revenue will come from and who you’ll target first.
As the team at Packed Data Services often highlights, a successful strategy doesn’t start with the world. It starts with the Ideal Customer Profile (ICP). Modern account intelligence platforms enable this precision by transforming market sizing from guesswork into science.
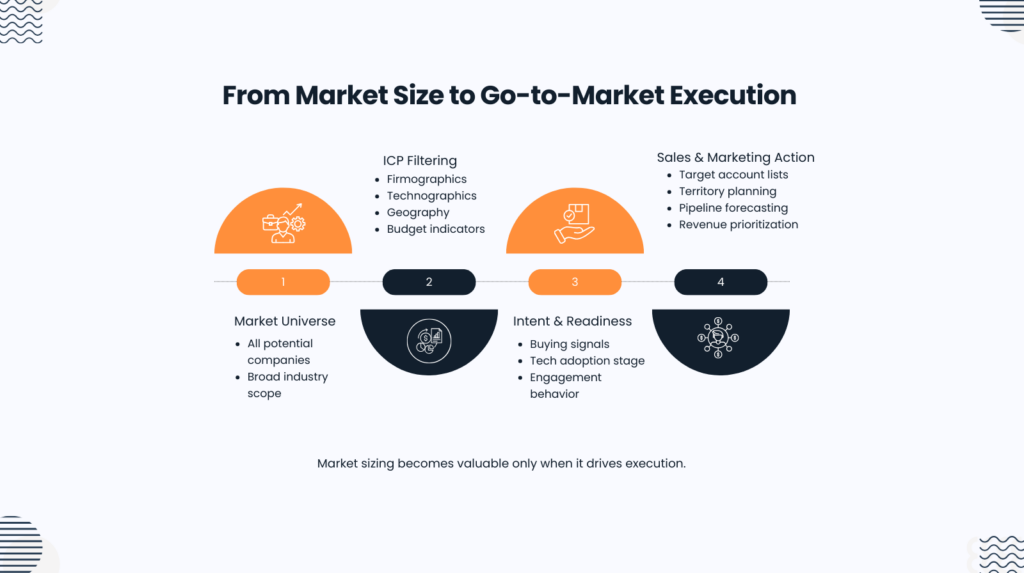
From Theory to Data: The Inputs That Drive Accuracy
The bottom-up approach necessitates comprehensive data inputs. Firstly, firmographic attributes should be considered: company size, revenue range, industry vertical, and geographic location, growth stage, and employee count. These are the features that help decide if the prospects align with your ICP.
Layer technographic data revealing the technology stack prospects currently use. If you sell marketing automation software, knowing a prospect uses Salesforce but lacks integrated email tools indicates strong fit. If they already use a comprehensive platform addressing their needs, conversion probability drops significantly. Platforms providing real-time company insights enable this level of specificity.
The calculation becomes surgical. Rather than citing “$50 billion SaaS market,” you identify 200,000 businesses with 50 to 500 employees, specific technology stacks signaling need, and budget indicators suggesting purchasing capacity. Multiply by your average contract value. Now you have defensible TAM grounded in actual accounts you target.
Refining TAM SAM SOM Calculation by Tech Sophistication
Not all companies within your TAM are at the same level of readiness to purchase your solution. The adoption of any technology follows a maturity curve. Very different needs, budgets, and buying schedules are typical of companies at different stages of their digital reformation.
This is where technographic segmentation becomes strategic. Filter your TAM by digital maturity score to target only companies ready for your level of technology. If your product requires integration with modern cloud infrastructure, pursuing companies still running legacy on-premises systems wastes sales cycles.
Packed Data Services’ approach to ICP analytics enables this filtering. By analyzing technology adoption patterns, you identify accounts using complementary tools signaling readiness for your solution. A company recently migrating to cloud platforms likely has budget allocated for additional cloud-native tools.
Break down your TAM according to different levels of technological sophistication. Early adopters operate on cutting, edge tech stacks, show openness to trying new solutions, and usually have separate budgets for innovation. These clients get closed faster but are a smaller market segment.
Mainstream adopters follow proven solutions once established, require more validation and case studies, and represent the largest market segment. Your SAM likely concentrates here. Laggards resist new technology, require extensive education, and often lack budget for unproven solutions.
This segmentation prevents a common pitfall: claiming enormous TAM that includes companies who won’t buy for years. A $50 billion TAM means nothing if 40 billion of it represents organizations not ready for your solution.
Geographic Expansion Strategy
Geographic segmentation transforms TAM from global abstraction into regional execution plan. SAM calculation narrows TAM by applying geographic filters. If your TAM includes every qualifying company globally but your current sales team only serves North America, your SAM focuses on the addressable North American market.
Real-time company insights platforms reveal where ICP density concentrates geographically. This intelligence guides expansion strategy. Which international regions contain the highest concentration of companies matching your ideal customer profile?
Smart geographic expansion uses data to sequence market entry. Start with regions showing highest ICP concentration, lowest competitive intensity, and strongest buying signals. Packed Data Services’ real-time company insights enable this analysis by revealing where accounts matching your profile show active interest in solutions like yours.
TAM SAM SOM Calculation as a Boardroom Asset
Getting the market size right is a ticket to securing funding, setting sales quotas that your salespeople can hit, and it also helps you decide where to put your resources throughout your business. If you show a bottom, up TAM backed by firmographic data, technographic analysis, and actual account counts, you are already on the path of demonstrating strategic thinking for which investors highly reward you.
The investor pitch requires both scale and precision. While the TAM highlights a massive opportunity worthy of venture investment, the SAM narrows that focus to a segment you can realistically capture. From there, your SOM provides a clear roadmap for your most immediate, achievable targets.
Platforms like Packed Data Services provide the data foundation making this story credible. Instead of citing generic industry reports, you show investors the actual universe of target accounts, enriched with buying signals and technology fit indicators. This transforms market sizing from theoretical to tactical.
The message for the founders who rely heavily on data is unquestionable: top-down market sizing is not enough anymore. Investors expect accuracy. Sales teams need feasible targets. Fast and efficient growth is only possible if one is aware of the concentration of the demand.
Companies that view market sizing as a strategic capability and not a pitch deck requirement enjoy a sustainable competitive edge. They channel their resources towards the real market that offers opportunities. They give sales targets that the sales teams can accomplish. Their businesses are based on data, and not on wishful thinking.