


Admin Jul 9th, 2026

The average B2B GTM stack ingests data from nearly 13 separate sources per account, yet 83% of revenue teams report drowning in metrics rather than acting on them. The fix isn’t more data. It’s GTM signal extraction: the systematic process of isolating patterns that actually predict pipeline outcomes from the noise that doesn’t. Without it, teams run longer sales cycles, misfired campaigns, and leadership that’s lost faith in their dashboards.”
According to Gartner, 87% of enterprises still assess themselves as low in analytics maturity despite the availability of unprecedented amounts of data.
The issue isn’t too much data, but detecting decision-relevant signals amid operational noise. Poor signal detection wastes analysis, misallocates pipeline, lengthens sales cycles, and erodes executive trust in data.
One of the studies cited by the LinkedIn B2B Institute provided 5 data points per race to professional gamblers, then 10, 20, and 40. With each additional data point, confidence levels doubled, while accuracy remained the same. Gamblers were two times as confident with 40 data points but no more accurate. Additional data created an environment for more confident mistakes.
The same logic is applied to revenue operations in modern companies. Monitoring 150 different metrics simultaneously makes it inevitable by the laws of probability to find 7-8 metrics with statistically significant changes every single week simply by luck. Teams start investigating fictional trends while a steadily worsening metric which predicts future quarterly decline is ignored.
A study conducted by Forrester discovered that companies relying on less than 30% of genuine predictive signals face sales processes that take 23% longer and have win rates 19% lower than those in signal-optimized firms. This loss does not stem from inefficiencies but rather from the poor allocation of revenue potential to unlikely accounts.
Understanding what GTM signal extraction targets requires a clear distinction between signals and noise. In GTM, signals are data patterns linked to pipeline conversion, churn, expansion, or win rate. On the other hand, noise refers to patterns which do not correlate with any business outcome.
Examples of signals are a change in the leadership within a target account, a consistent increase in visits by multiple stakeholders to the pricing pages or changes in back-end software infrastructure. All these data points exhibit a high level of correlation with pipeline conversion.
Low-level activity includes career-page traffic, new-employee downloads, and bots. Old contact info also skews lead and account-scoring models. All of these metrics correlate with broader market activity but do not causally link to a purchase decision.
High-signal metrics like intent-based pipeline and ICP-based conversion metrics, according to a 2025 RevOps benchmark, had correlation coefficients of 0.4 to 0.6 with revenue-related outcomes. Low-signal metrics like secondary click-throughs correlated at less than 0.1 and exhibited wild swings without any business impact. Out of all correlations of intent signals to pipeline growth, 36% were confounded, and only 19% were causal.
Thus, testing is needed to extract the signal.
You can read more about intent data accuracy here.
Three structural failures drive most signal extraction problems.
Excessive metrics is the main reason. The average GTM company implements 3.2 new KPIs each quarter but only removes 0.4. In 2024, according to a RevOps case study, one company never used 68% of all KPIs it measured in the decision-making process (routing, sequencing, scoring). If everything is measured, nothing becomes important.
Poorly developed dashboards make the situation even worse. According to a 2025 benchmark, 72% of all GTM dashboards did not have an obvious hierarchy of KPIs. Important metrics were often overlooked by leadership due to visual complexity – there were too many other KPIs that overshadowed the most significant.
Absence of prioritization frameworks is the third failure. Only 21% of GTM groups have a framework for metric prioritization documented. In the absence of any formal criteria to differentiate predictive metrics from descriptive metrics, teams respond to the metrics that are most visible.
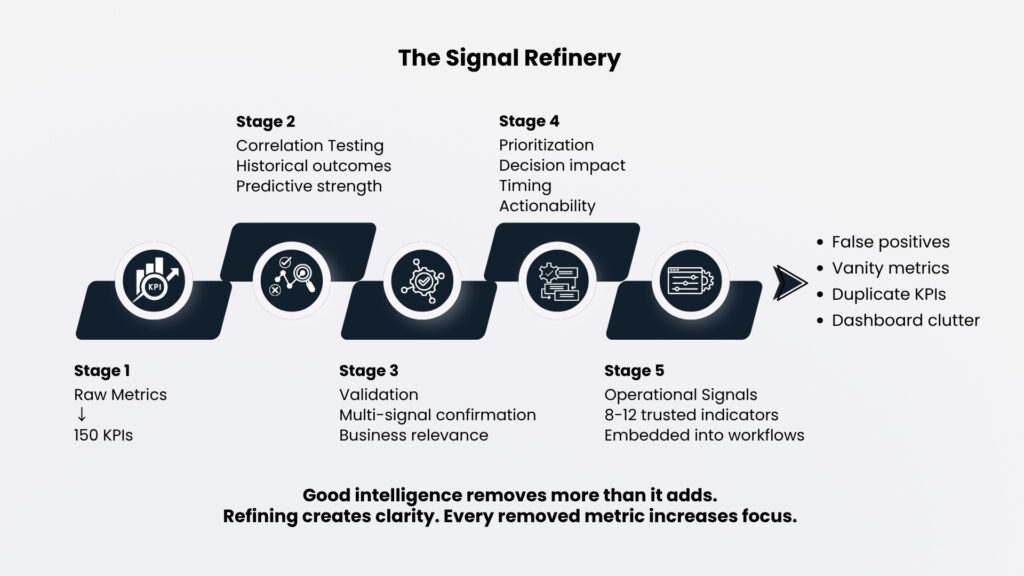
Signal evaluation needs to consider the indicator in terms of two criteria: predictive ability and decision impact.
Predictive ability refers to the strength of the correlation of the metric and the results. Look at the historical data for closed wins and losses over the past year. Good signals have a correlation of at least 60% with outcomes, which occurred 30 or more days prior to closing. Poor signals are those that have less than 35% correlation.
Decision impact evaluates the degree to which the signal gives you enough advance warning to be actionable. A good indicator changes 15+ days early, applies to 20%+ opportunities, and has a reaction playbook.
Metrics plotted out on these two dimensions yield four types. Strategic signals are metrics that have both high prediction as well as high leverage for making decisions. These 8 to 12 metrics should influence everyday operations. They would include metrics such as spikes in intent score on strategic accounts, champion turnover, and multi-stakeholder engagement. Diagnostic metrics are ones that give accurate predictions but too late to impact the outcome, hence use these metrics in post-mortem situations. False positive metrics are changing very frequently but don’t affect outcomes; they can be measured only in aggregate form.
The Sales Management Association says that less than 12% of the common sales metrics have both prediction and actionable measures. On auditing your metrics against this framework, you would find that most companies measure 10 times as much noise as signals. This matrix is the operational core of any GTM signal extraction framework.
Three architectural changes will facilitate this evolution from metrics explosion to signal extraction.
Perform anomaly detection based on cohorts as opposed to fixed metrics. An enterprise opportunity that is 45 days old is performing well if the average enterprise opportunity is a 180-day cycle, but a transactional opportunity that is 45 days old has most likely fallen apart with a 30-day average. Cohort-based anomaly detection entails comparing the metric against baseline metrics established through deal sizes, industries, and buying stages. A 2024 RevOps study saved 17% of pipeline from churn by detecting drops 24-48 hours early.
Utilize multi-signal validation and not single metric alerts. A spike in intent score could mean an update for the record but not for an immediate trigger for outreach. If intent scores increase at the same time that buying groups expand and competitive intelligence shows that evaluators actively assess vendors, then the combination of the two becomes a reason to take action immediately. Multiple signals breed confidence. Single metrics create noise.
Set the thresholds of alerts to reflect business risks and not statistical conventions. When a false positive consumes $10 in SDR capacity while a false negative incurs a loss of $1,000, you must set the threshold much higher than when both costs are the same. The setting of thresholds is a business decision, not a statistical one.
Implementing GTM signal extraction starts with auditing what you’re already measuring.
Analyze each metric against the result achieved before doing anything to your dashboard. Pull the past 100 closed sales deals with historical data for each metric. Calculate how many won deals had positive readings for each of your metrics 30 days or more prior to closing and how many lost deals had negative readings at the same time period. As a rule of thumb, such an exercise eliminates 70 to 80 percent of your currently measured metrics based on their predictive value alone.
Trim your dashboard intelligently. Companies reducing the number of GTM-related KPIs by 42 percent but retaining all necessary data richness have achieved a 21 percent increase in decision-making velocity and 14 percent decrease in campaign-execution latency.
Focus on decision-making and not the completeness of information in building analytic solutions. Every dashboard must provide answers to specific operational questions: who should we reach out to, what opportunities have red flags, and which campaigns are producing pipelines. Metrics that fail to answer these questions must not appear in primary dashboards.
Feedback loop integration is vital in the creation of alerts. If an alert triggers and the rep acts on it, the result must be documented. This will help refine the threshold for trigger signals either way. Companies that incorporate such feedback continue to improve their signals every quarter.
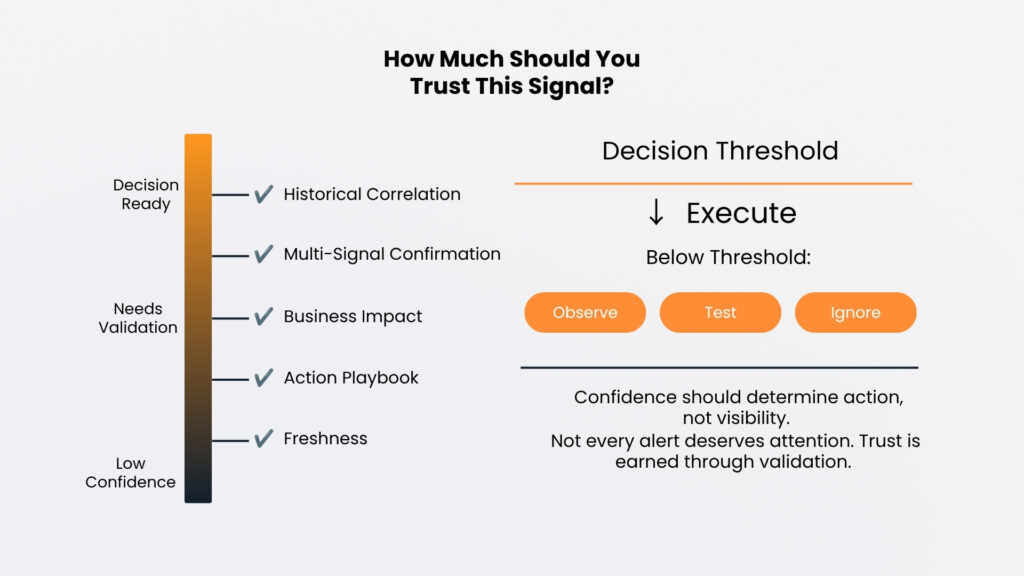
In today’s B2B revenue operations, the scarcity is not data, it’s signal. GTM signal extraction is now a structural competitive advantage, not a reporting exercise. With enrichment platforms, intent providers, and conversation intelligence becoming industry standards, all organizations can now rely on similar amounts of raw data. What makes the difference is the systematic approach to filtering of that data into actionable intelligence.
Companies that are good at generating signals are not only becoming more efficient. They are changing the course of their revenue. By focusing on the right metrics, those organizations are creating systematic competitive advantages in account selection, timing, and resource allocation.
The organizations who will lead in this space will be the ones who are able to figure out what really matters faster than everybody else.